MoneyLion Results Presentation Deck
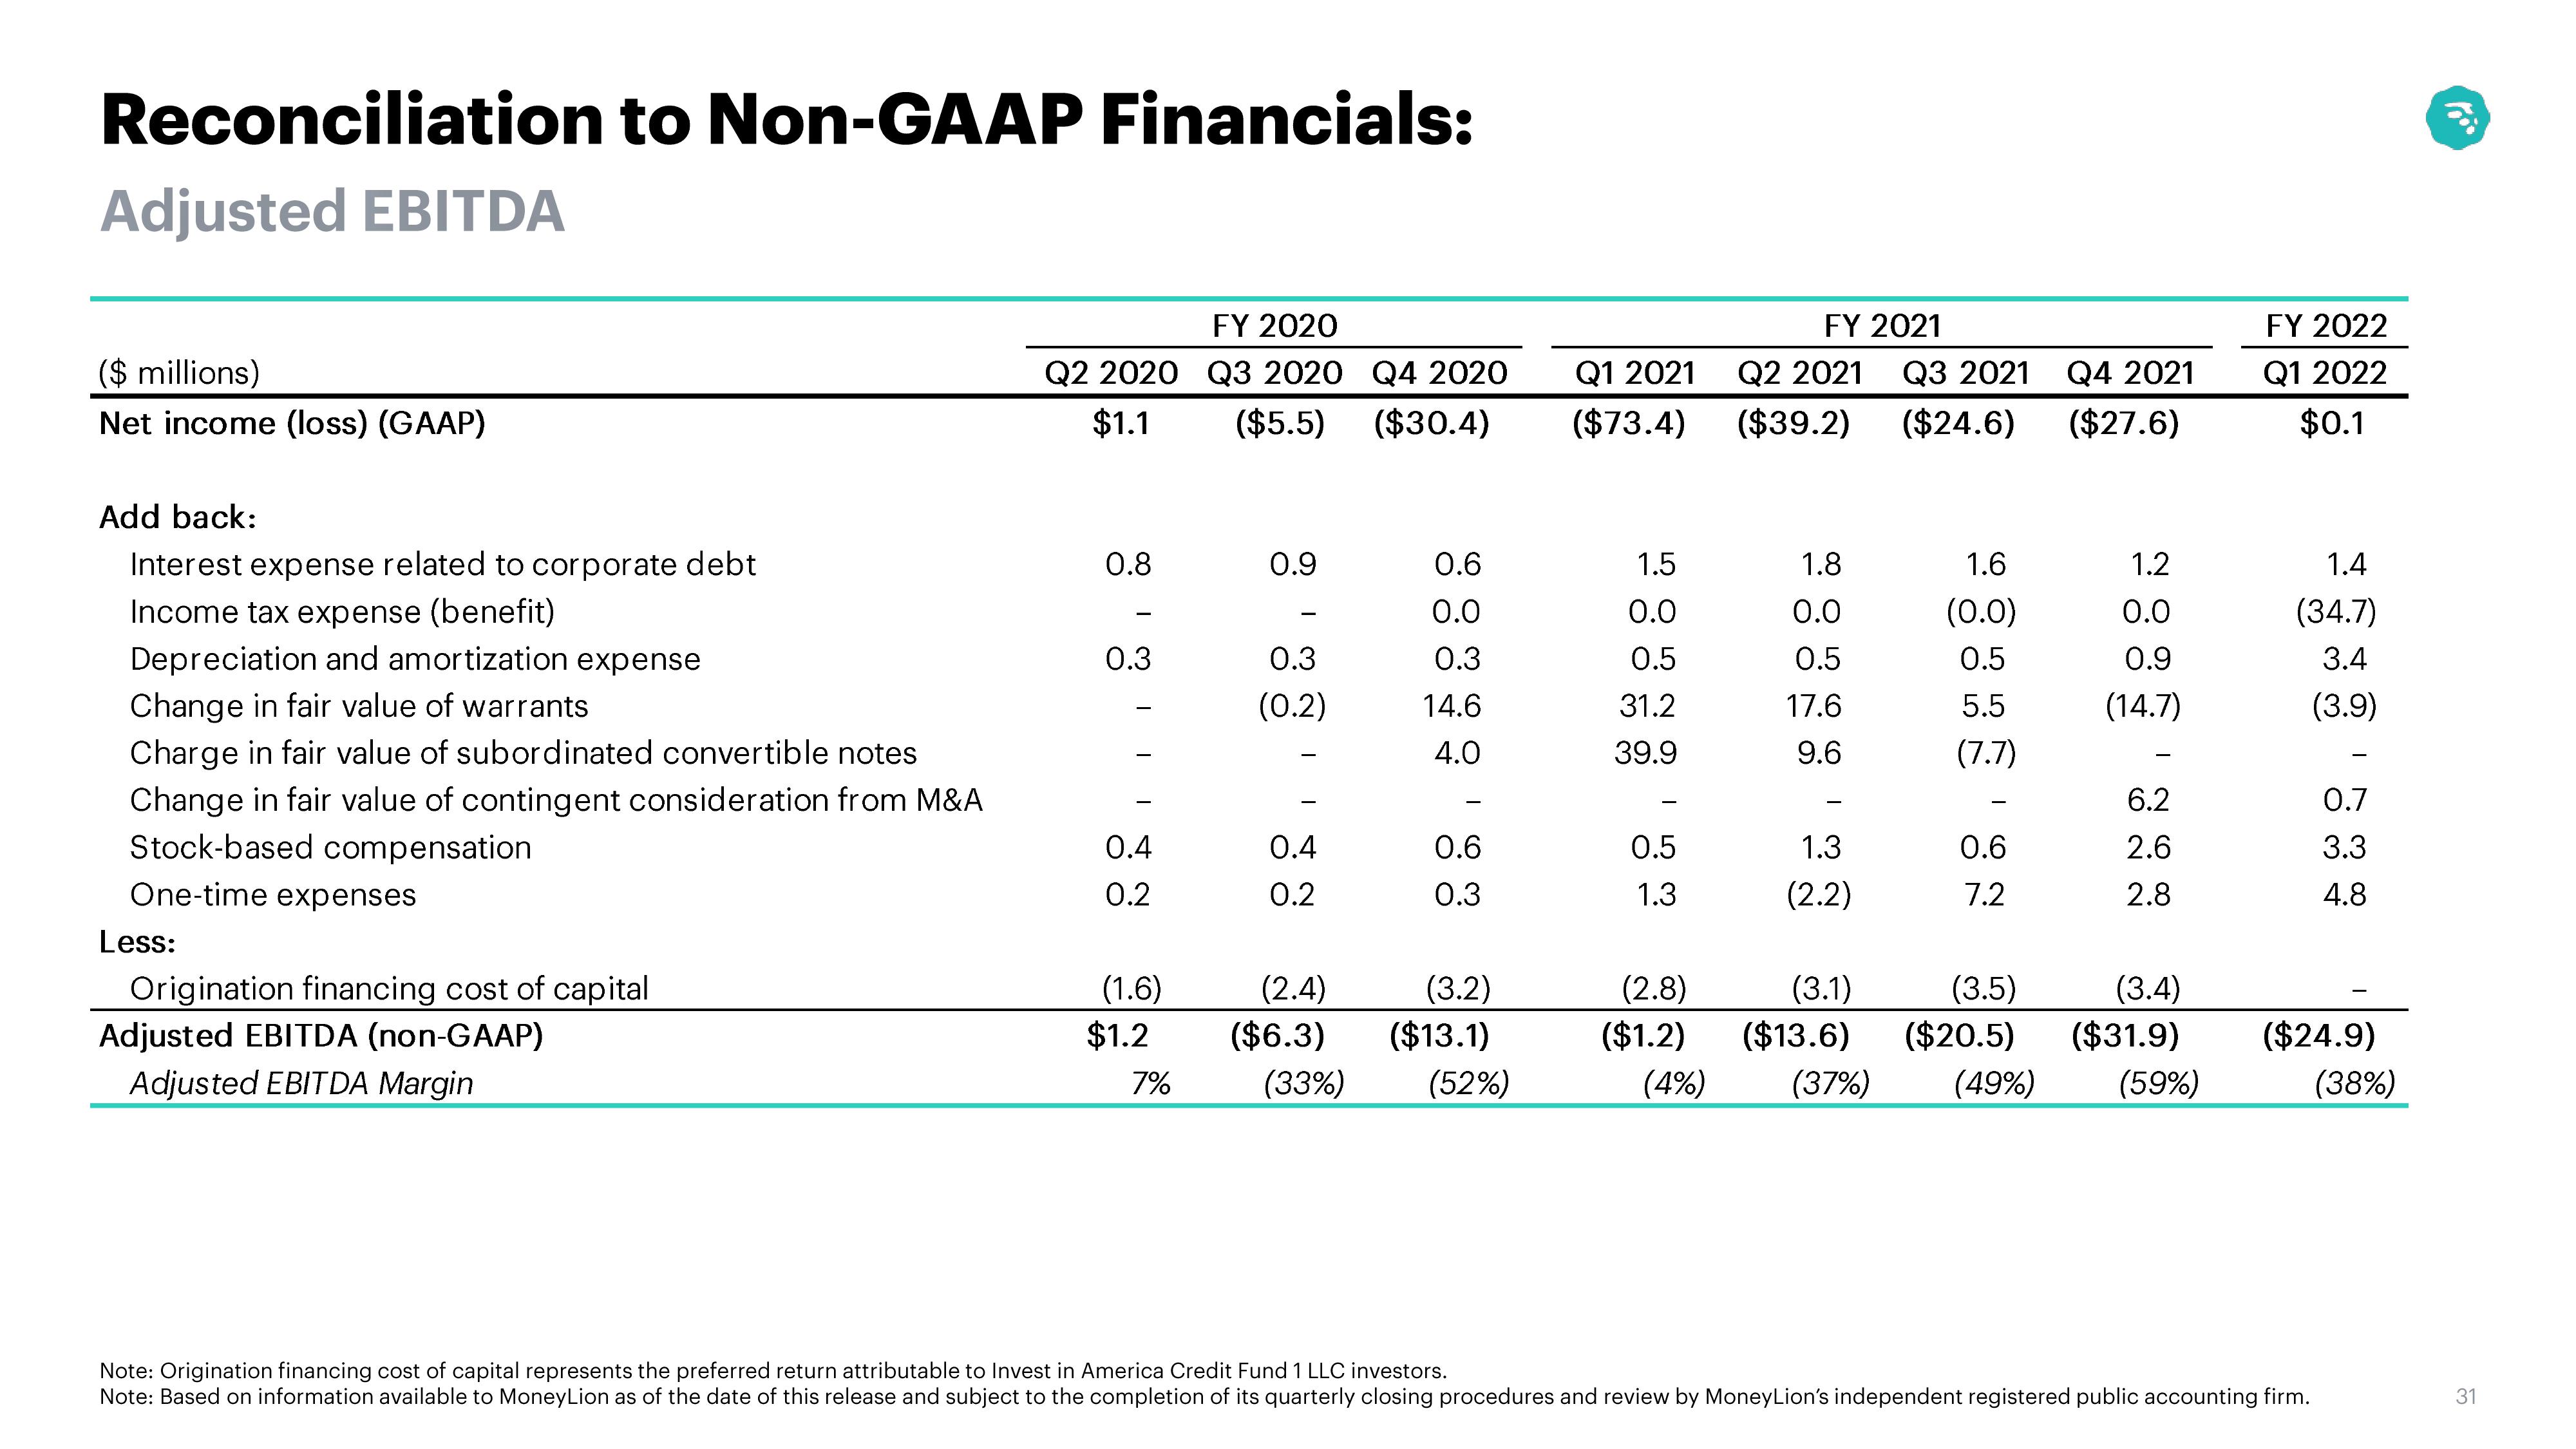
Reconciliation to Non-GAAP Financials:
Adjusted EBITDA
($ millions)
Net income (loss) (GAAP)
Add back:
Interest expense related to corporate debt
Income tax expense (benefit)
Depreciation and amortization expense
Change in fair value of warrants
Charge in fair value of subordinated convertible notes
Change in fair value of contingent consideration from M&A
Stock-based compensation
One-time expenses
Less:
Origination financing cost of capital
Adjusted EBITDA (non-GAAP)
Adjusted EBITDA Margin
Q2 2020
$1.1
0.8
0.3
0.4
0.2
(1.6)
$1.2
7%
FY 2020
Q3 2020 Q4 2020
($5.5) ($30.4)
0.9
0.3
(0.2)
0.4
0.2
0.6
0.0
0.3
14.6
4.0
0.6
0.3
(2.4) (3.2)
($6.3) ($13.1)
(33%)
(52%)
Q1 2021
($73.4)
1.5
0.0
0.5
31.2
39.9
0.5
1.3
FY 2021
Q2 2021
($39.2)
1.8
0.0
0.5
17.6
9.6
1.3
(2.2)
Q3 2021
($24.6)
1.6
(0.0)
0.5
5.5
(7.7)
0.6
7.2
Q4 2021
($27.6)
1.2
0.0
0.9
(14.7)
6.2
2.6
2.8
(3.5)
(3.4)
(2.8)
(3.1)
($1.2) ($13.6) ($20.5) ($31.9)
(4%) (37%) (49%) (59%)
FY 2022
Q1 2022
$0.1
1.4
(34.7)
3.4
(3.9)
0.7
3.3
4.8
($24.9)
(38%)
Note: Origination financing cost of capital represents the preferred return attributable to Invest in America Credit Fund 1 LLC investors.
Note: Based on information available to MoneyLion as of the date of this release and subject to the completion of its quarterly closing procedures and review by MoneyLion's independent registered public accounting firm.
31View entire presentation