Solar Industry Update
70
10
60
U.S. Generation Capacity Additions (GW₂c)
50
U.S. Generation Capacity Additions by
40
40
30
20
20
10
10
Source: 2010-2022 and
Planned 2023-2024
Avg. (2010-2014)
Avg. (2015-2019)
2020
2021
2022
2023
2024
Other
Nuclear
■Natural Gas (Other)
Natural Gas CT
Natural Gas CC
Batteries
Wind
DPV
62%
UPV
Began operating
through July 2023
Planned August 2023
and full 2024
•
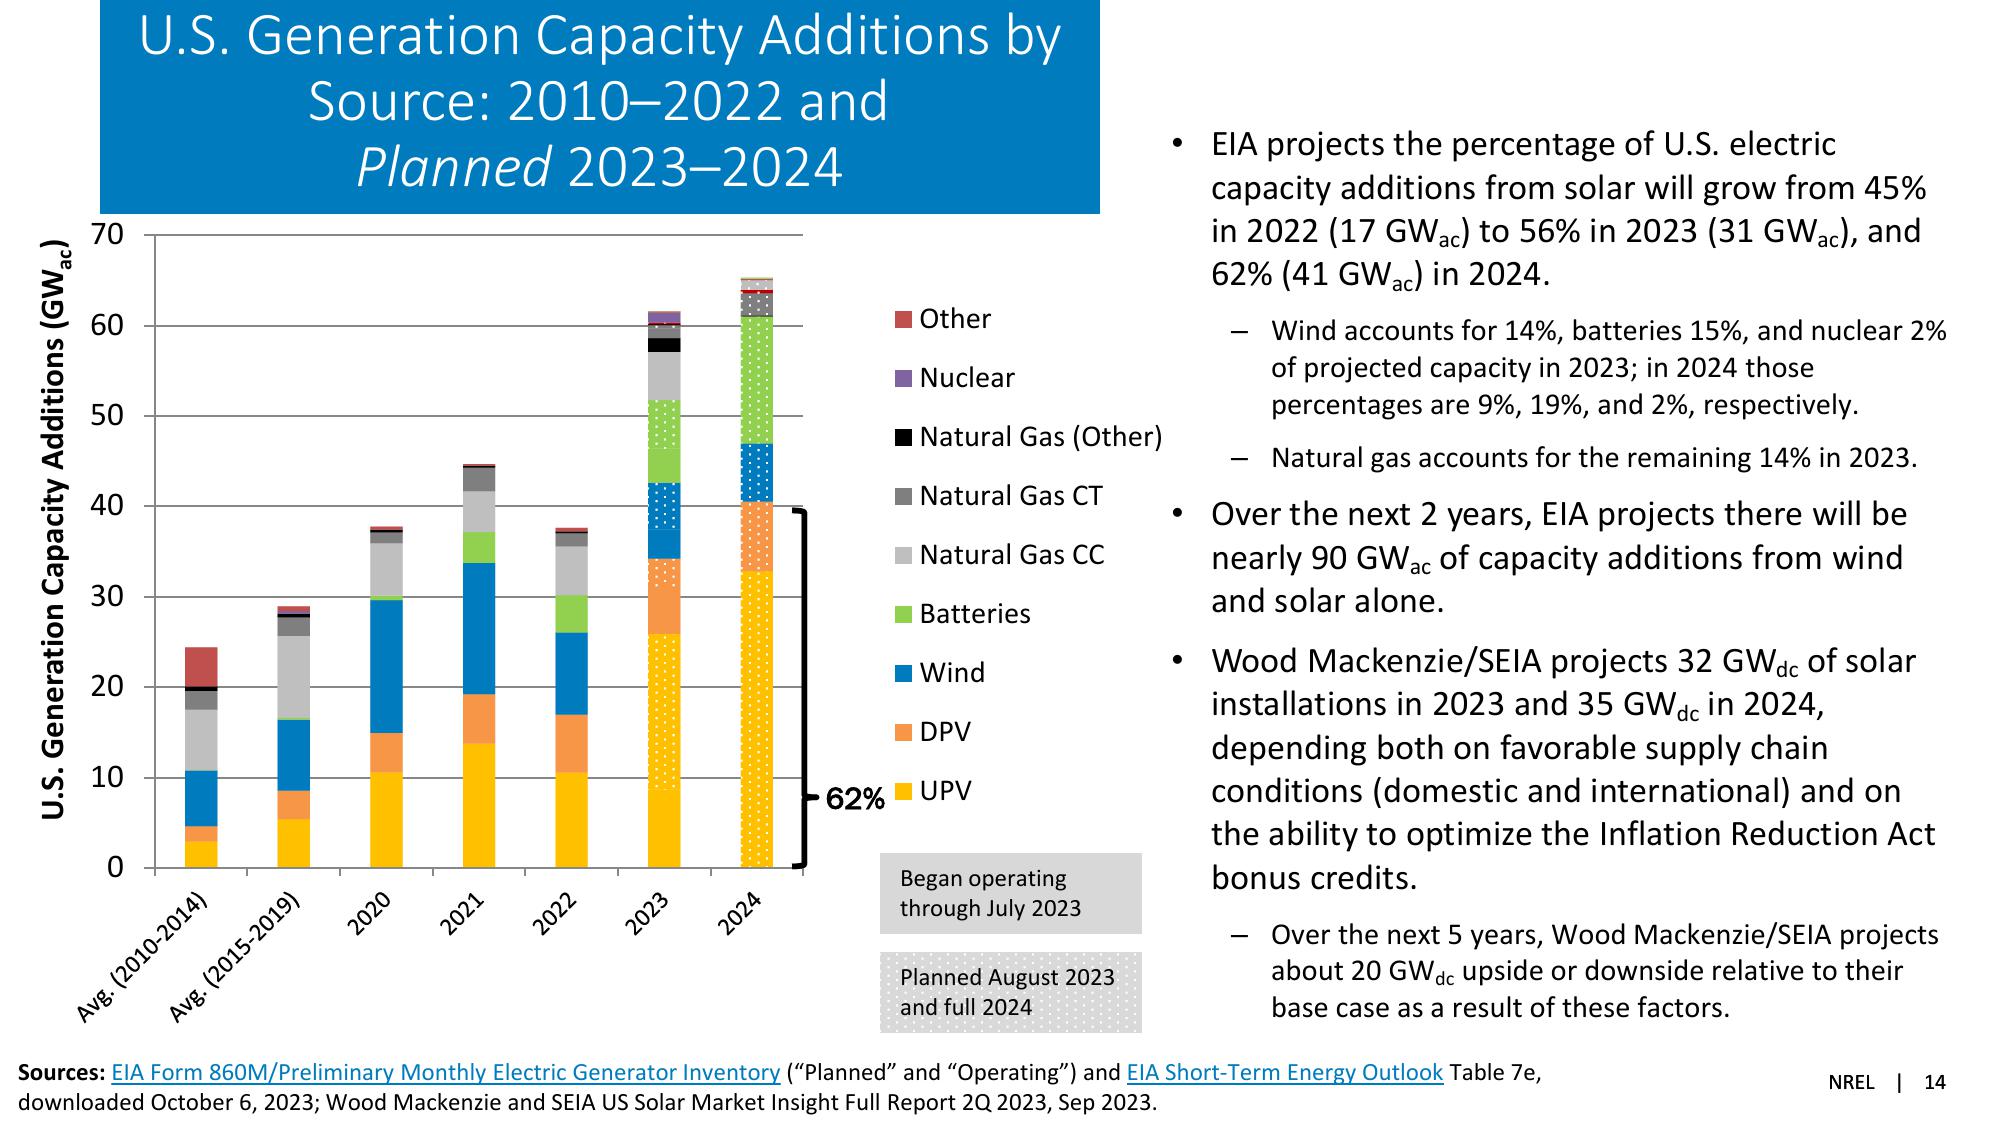
EIA projects the percentage of U.S. electric
capacity additions from solar will grow from 45%
in 2022 (17 GWac) to 56% in 2023 (31 GWac), and
62% (41 GWac) in 2024.
-
Wind accounts for 14%, batteries 15%, and nuclear 2%
of projected capacity in 2023; in 2024 those
percentages are 9%, 19%, and 2%, respectively.
Natural gas accounts for the remaining 14% in 2023.
Over the next 2 years, EIA projects there will be
nearly 90 GW ac of capacity additions from wind
and solar alone.
Wood Mackenzie/SEIA projects 32 GWdc of solar
installations in 2023 and 35 GWdc in 2024,
depending both on favorable supply chain
conditions (domestic and international) and on
the ability to optimize the Inflation Reduction Act
bonus credits.
Over the next 5 years, Wood Mackenzie/SEIA projects
about 20 GW dc upside or downside relative to their
base case as a result of these factors.
Sources: EIA Form 860M/Preliminary Monthly Electric Generator Inventory ("Planned" and "Operating") and EIA Short-Term Energy Outlook Table 7e,
downloaded October 6, 2023; Wood Mackenzie and SEIA US Solar Market Insight Full Report 2Q 2023, Sep 2023.
NREL 14View entire presentation