Palantir Results Presentation Deck
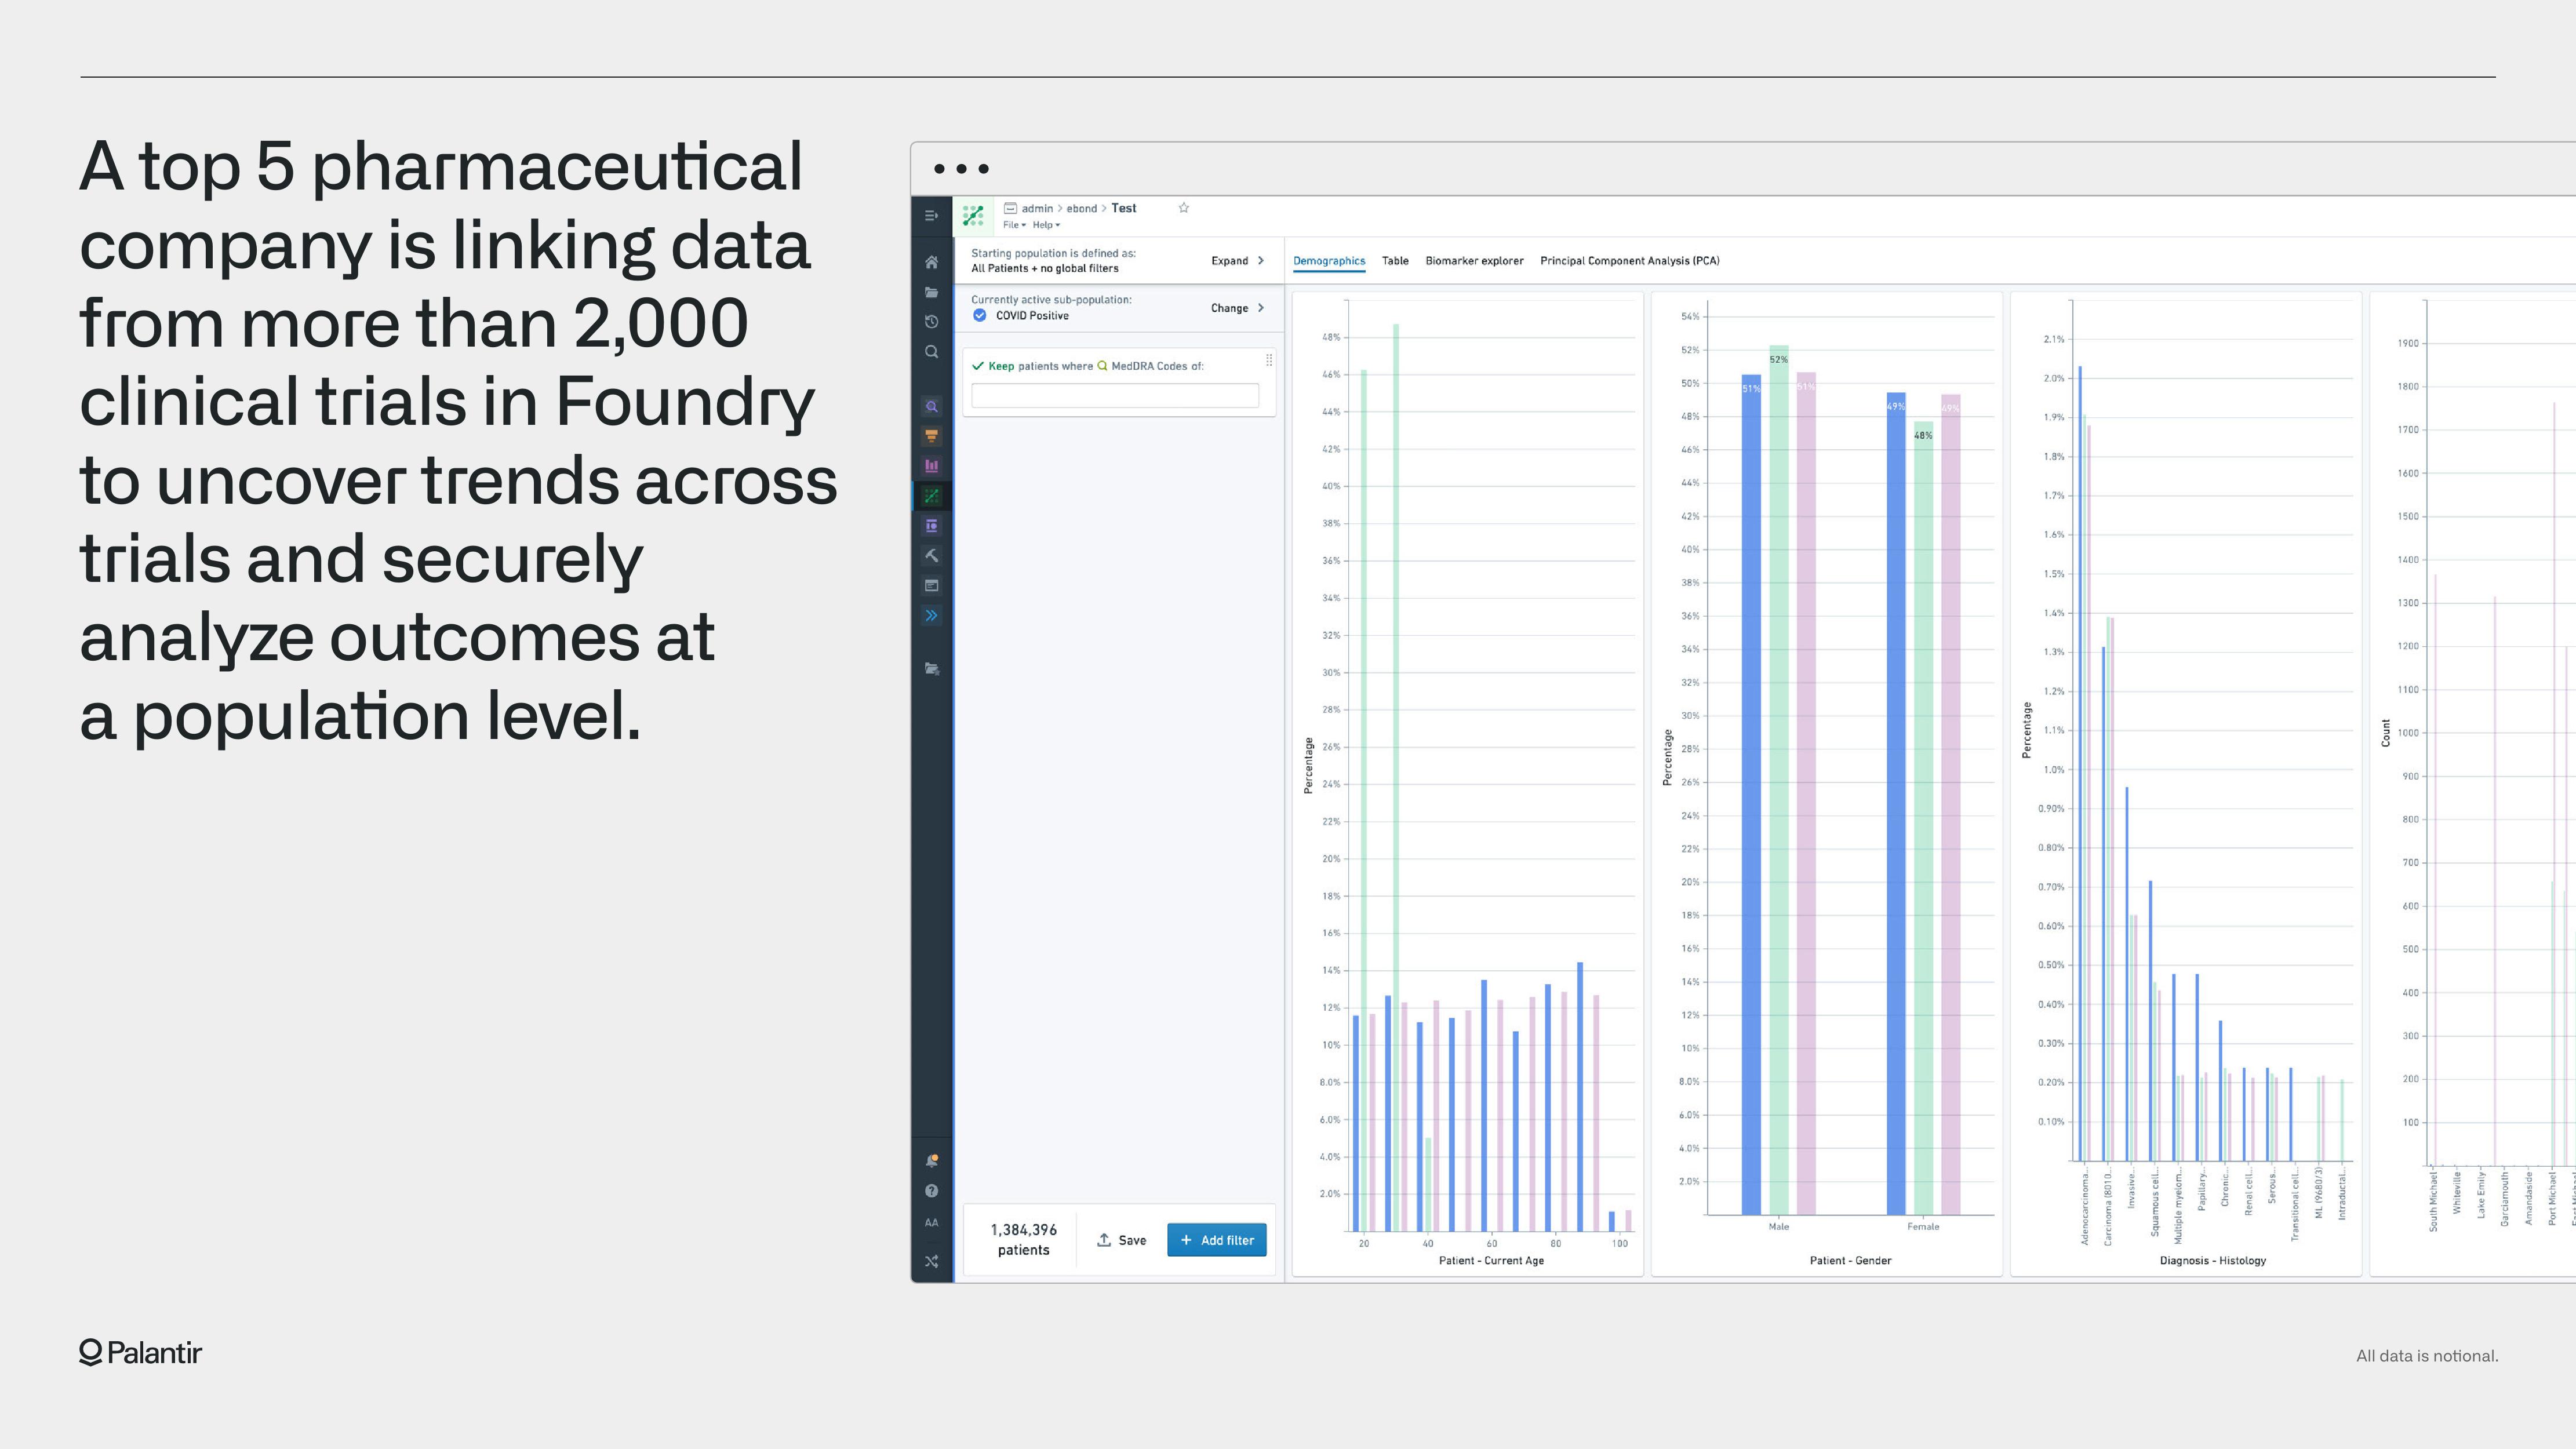
A top 5 pharmaceutical
company is linking data
from more than 2,000
clinical trials in Foundry
to uncover trends across
trials and securely
analyze outcomes at
a population level.
QPalantir
...
☎
O
Q
x
admin > ebond > Test
File Help
Starting population is defined as:
All Patients no global filters
Currently active sub-population:
COVID Positive
✓ Keep patients where Q MedDRA Codes of:
1,384,396
patients.
↑ Save
Expand >
Change >
+ Add filter
I
Demographics Table Biomarker explorer Principal Component Analysis (PCA)
Percentage
48%
42%
38%
36%-
34%
32%
30%-
28%-
24%-
22%
20%
18%
14%-
10%
8.0% -
6.0%-
2.0 %-
20
40
60
Patient - Current Age
80
100
54%
52%
50%
48%
44%
40%
36%
34%
32%
30%
28%
26%
24%
22%
20%
18%
16%
14%
10%
8.0 %
6.0%
2.0%
Male
Patient Gender
Female
2.1%
2.0 % -
1.9%
1.8%
1.7%
1.5%
1.3%-
1.2% -
0.90%
0.80%
0.70%
0.60%-
0.50%-
0.40%-
0.30 % -
0.20%
0.10%-
Chronic
Diagnosis - Histology
Serous
(5/0996) 1
Count
1900
1800
1700
1400
1500
1400
1300
1200
1100
1000
900
800
700-
600
500
400
All data
notional.View entire presentation