Silicon Valley Bank Results Presentation Deck
Continued market volatility drove further valuation markdowns
Q3'22 activity
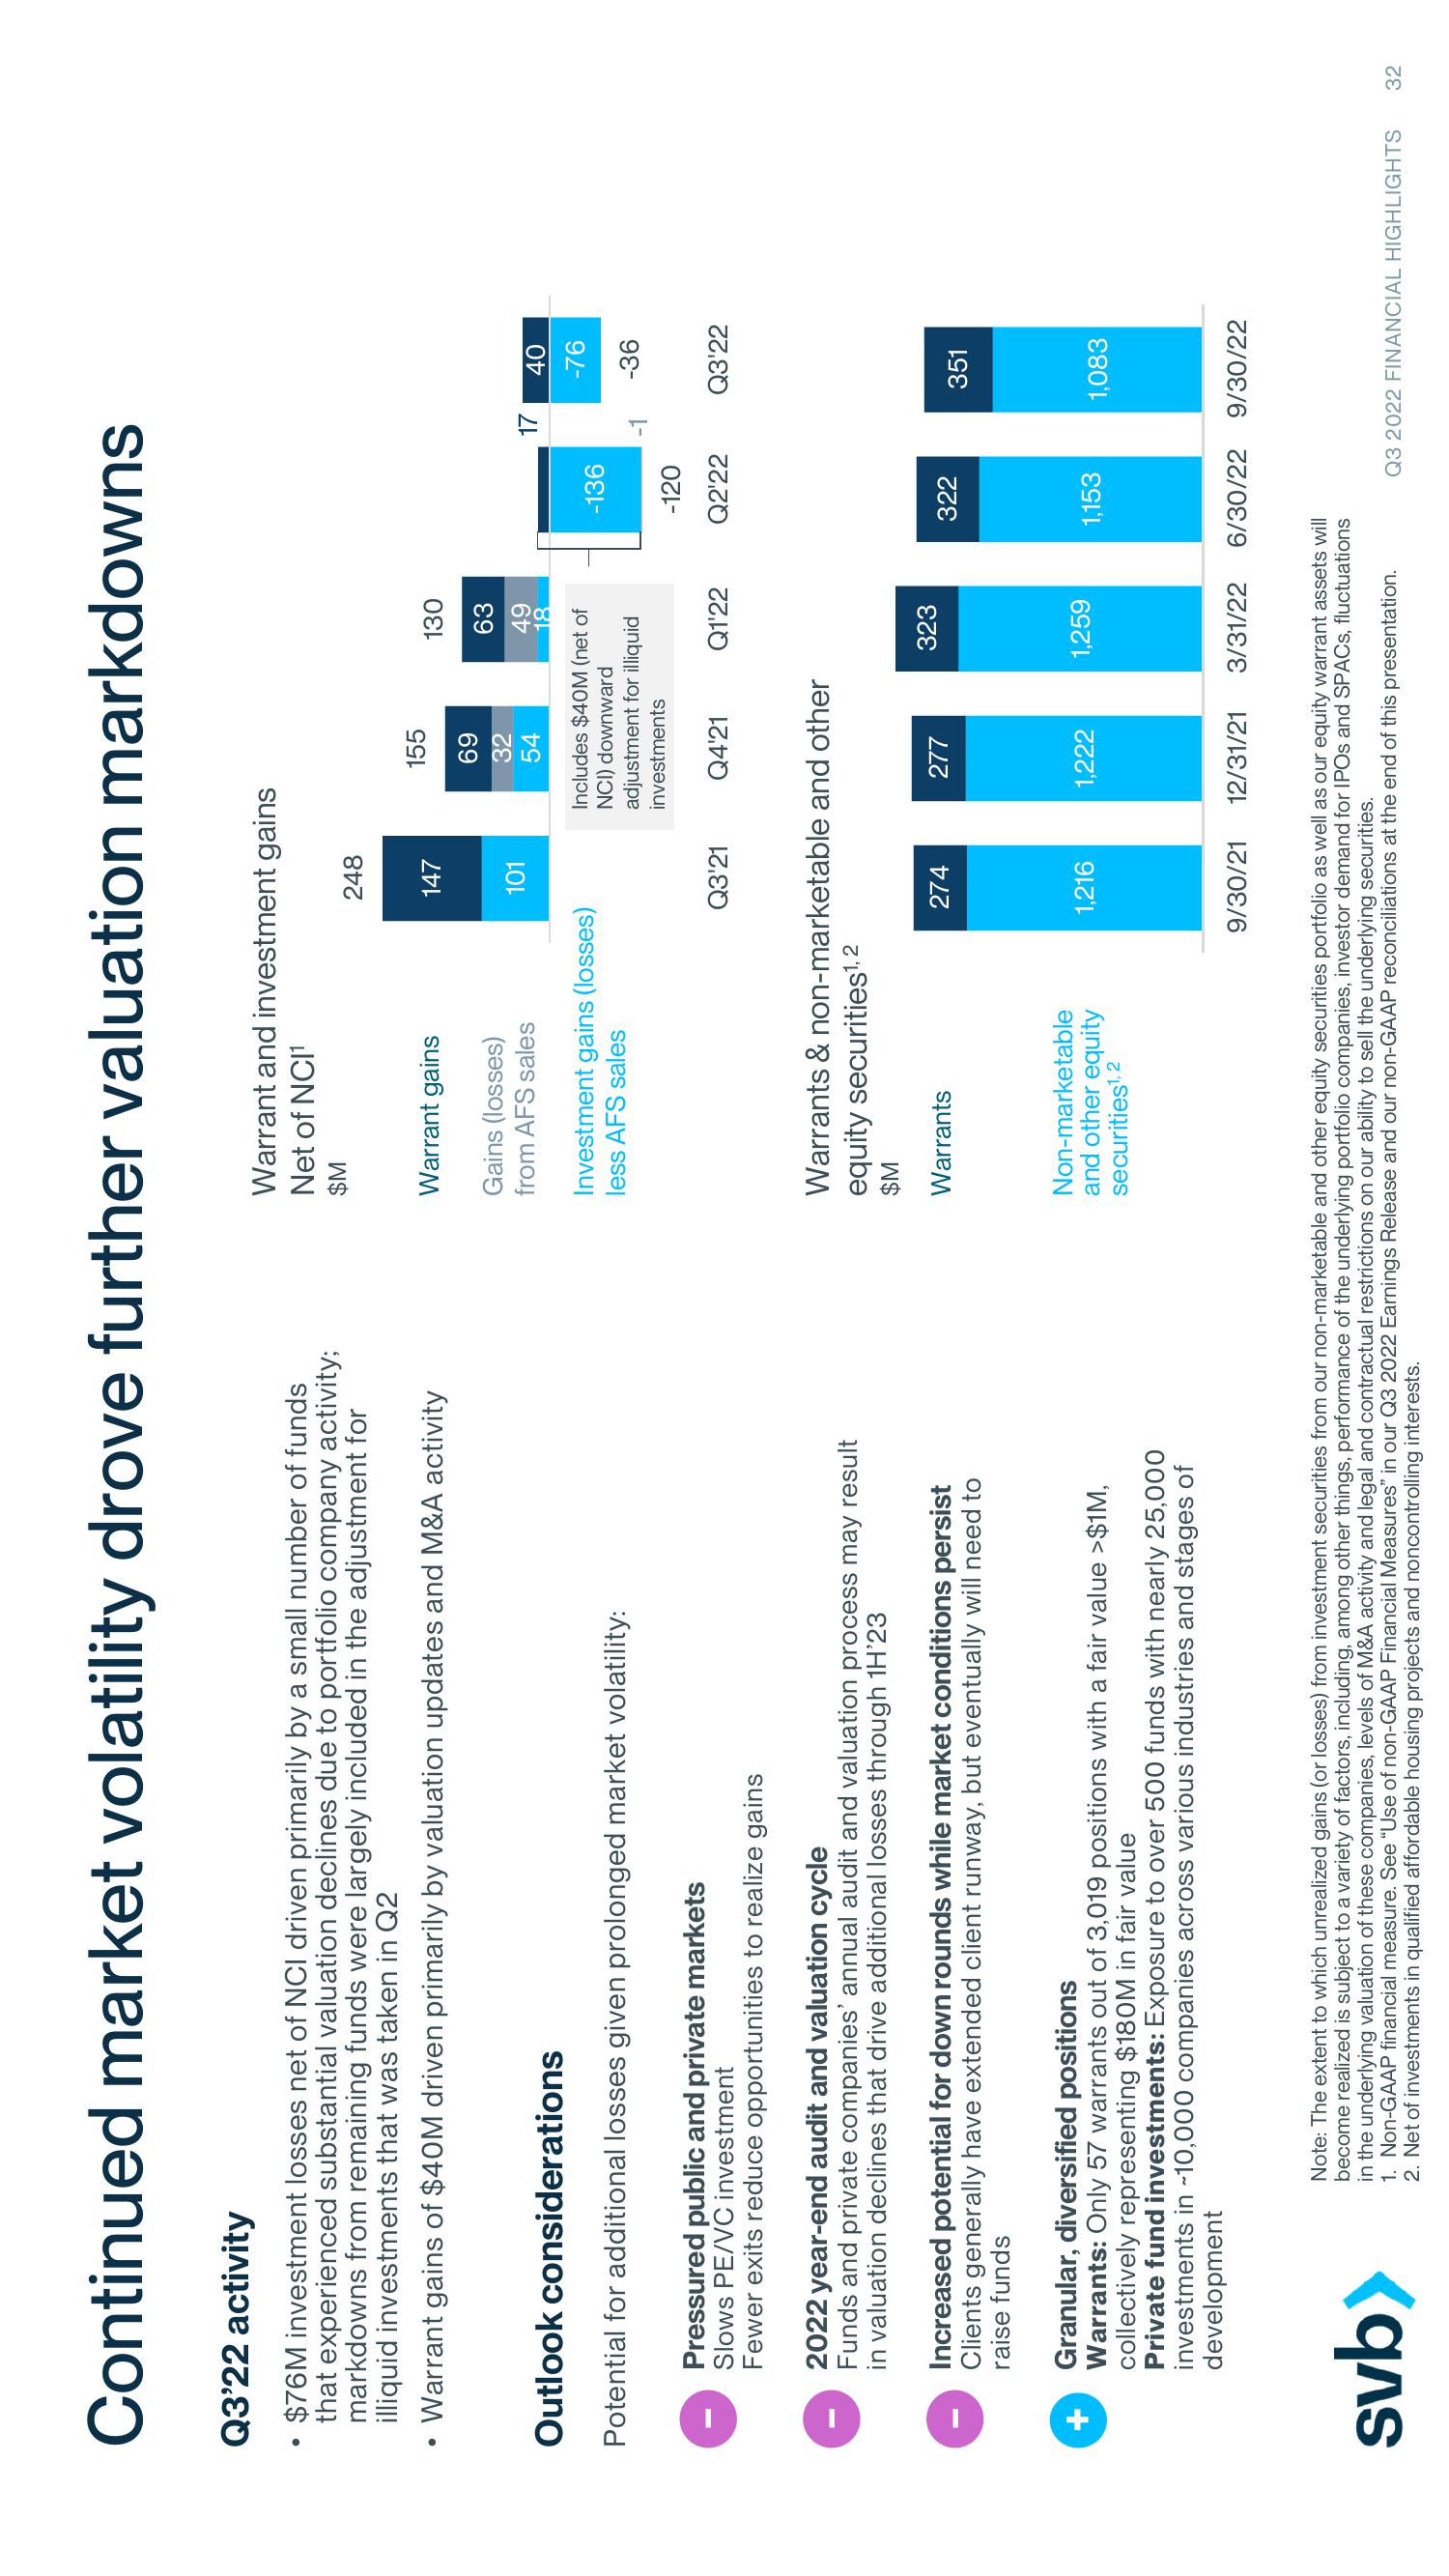
• $76M investment losses net of NCI driven primarily by a small number of funds
that experienced substantial valuation declines due to portfolio company activity;
markdowns from remaining funds were largely included in the adjustment for
illiquid investments that was taken in Q2
Warrant gains of $40M driven primarily by valuation updates and M&A activity
●
Outlook considerations
Potential for additional losses given prolonged market volatility:
Pressured public and private markets
Slows PE/VC investment
Fewer exits reduce opportunities to realize gains
+
2022 year-end audit and valuation cycle
Funds and private companies' annual audit and valuation process may result
in valuation declines that drive additional losses through 1H'23
Increased potential for down rounds while market conditions persist
Clients generally have extended client runway, but eventually will need to
raise funds
Granular, diversified positions
Warrants: Only 57 warrants out of 3,019 positions with a fair value >$1M,
collectively representing $180M in fair value
Private fund investments: Exposure to over 500 funds with nearly 25,000
investments in ~10,000 companies across various industries and stages of
development
svb>
Warrant and investment gains
Net of NCI¹
$M
Warrant gains
Gains (losses)
from AFS sales
Investment gains (losses)
less AFS sales
Warrants
248
Non-marketable
and other equity
securities¹, 2
147
101
Q3'21
Warrants & non-marketable and other
equity securities¹, 2
$M
274
1,216
155
69
32
54
9/30/21
Includes $40M (net of
NCI) downward
adjustment for illiquid
investments
Q4'21
277
1,222
130
63
49
18
12/31/21
Q1'22
323
1,259
-136
-120
Q2'22
322
1,153
Note: The extent to which unrealized gains (or losses) from investment securities from our non-marketable and other equity securities portfolio as well as our equity warrant assets will
become realized is subject to a variety of factors, including, among other things, performance of the underlying portfolio companies, investor demand for IPOs and SPACs, fluctuations
in the underlying valuation of these companies, levels of M&A activity and legal and contractual restrictions on our ability to sell the underlying securities.
1. Non-GAAP financial measure. See "Use of non-GAAP Financial Measures" in our Q3 2022 Earnings Release and our non-GAAP reconciliations at the end of this presentation.
2. Net of investments in qualified affordable housing projects and noncontrolling interests.
17
40
-76
-1 -36
Q3'22
351
1,083
3/31/22 6/30/22 9/30/22
Q3 2022 FINANCIAL HIGHLIGHTS 32View entire presentation