AT&T Investor Day Presentation Deck
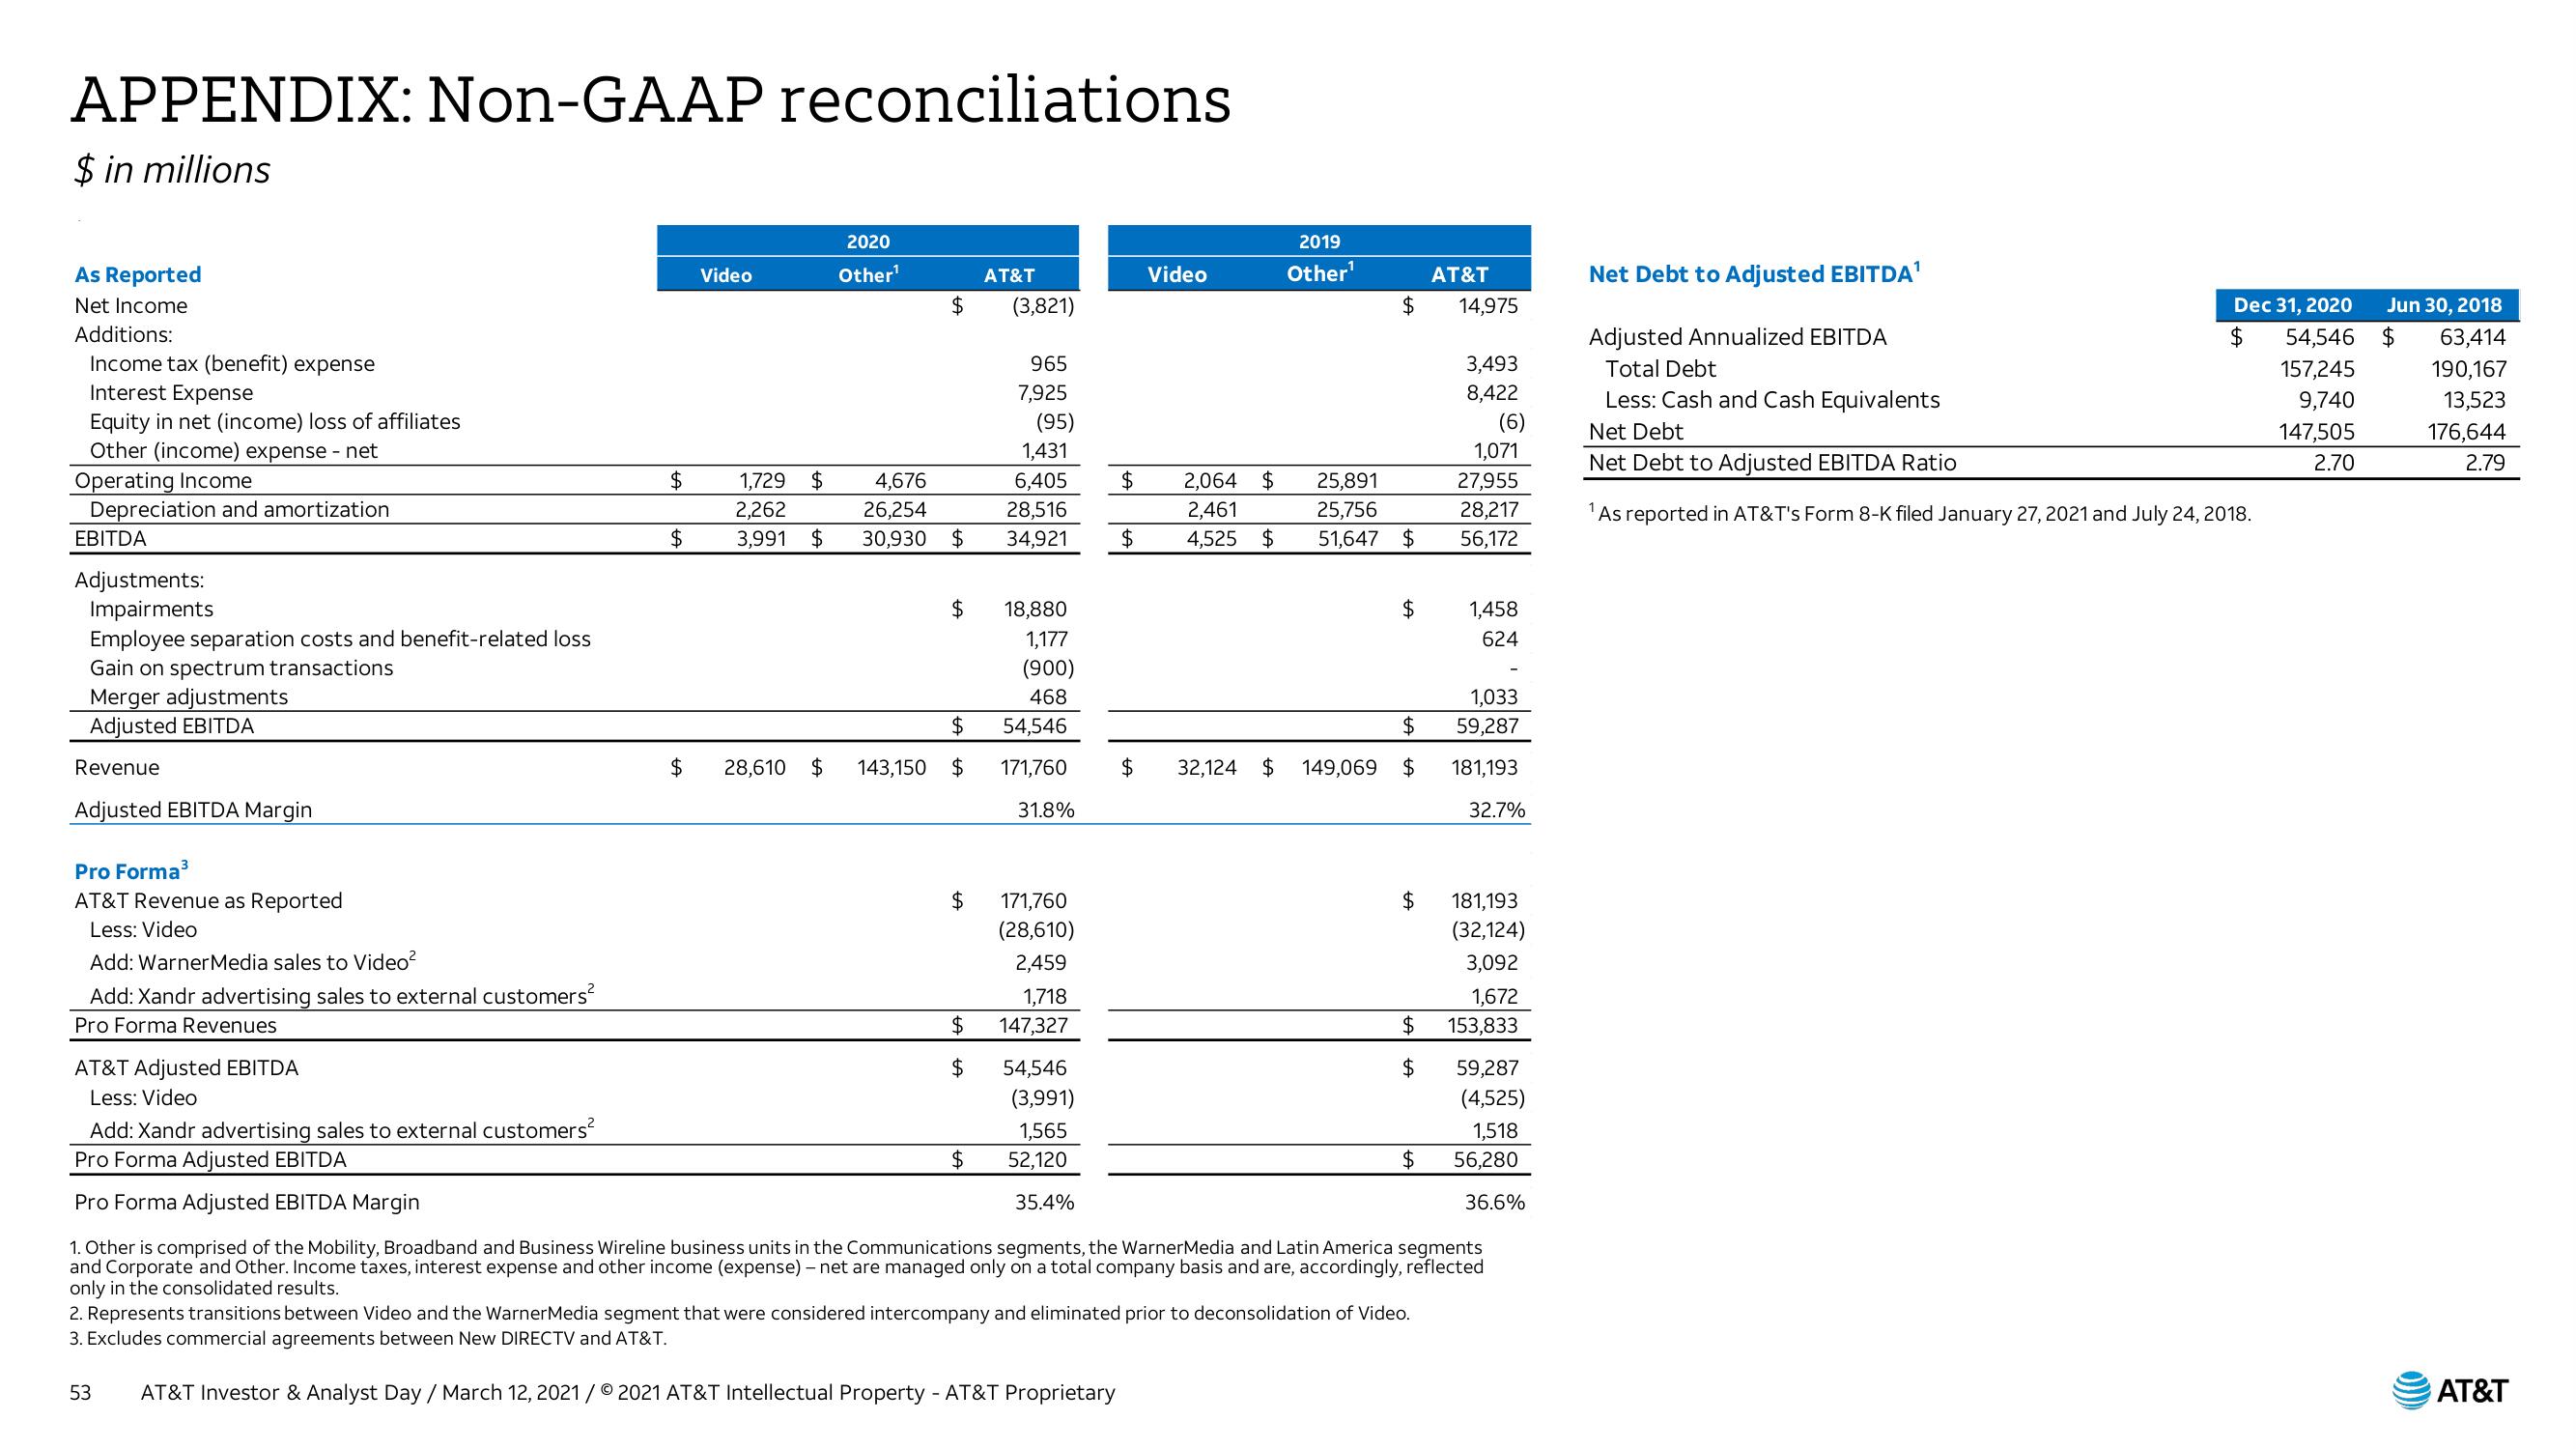
APPENDIX: Non-GAAP reconciliations
$ in millions
As Reported
Net Income
Additions:
Income tax (benefit) expense
Interest Expense
Equity in net (income) loss of affiliates
Other (income) expense - net
Operating Income
Depreciation and amortization
EBITDA
Adjustments:
Impairments
Employee separation costs and benefit-related loss
Gain on spectrum transactions
Merger adjustments
Adjusted EBITDA
Revenue
Adjusted EBITDA Margin
Pro Forma³
AT&T Revenue as Reported
Less: Video
Add: Warner Media sales to Video²
Add: Xandr advertising sales to external customers²
Pro Forma Revenues
AT&T Adjusted EBITDA
Less: Video
Add: Xandr advertising sales to external customers²
Pro Forma Adjusted EBITDA
Pro Forma Adjusted EBITDA Margin
$
$
Video
1,729 $
2,262
3,991 $
2020
Other¹
$
4,676
26,254
30,930 $
$
$
$ 28,610 $ 143,150 $
$
$
$
$
AT&T
(3,821)
965
7,925
(95)
1,431
6,405
28,516
34,921
18,880
1,177
(900)
468
54,546
171,760
31.8%
171,760
(28,610)
2,459
1,718
147,327
54,546
(3,991)
1,565
52,120
35.4%
$ 2,064 $
2,461
4,525 $
$
Video
$
32,124 $
2019
Other¹
AT&T
$ 14,975
25,891
25,756
51,647 $
$
$
149,069 $
$
$
$
$
3,493
8,422
2. Represents transitions between Video and the WarnerMedia segment that were considered intercompany and eliminated prior to deconsolidation of Video.
3. Excludes commercial agreements between New DIRECTV and AT&T.
53 AT&T Investor & Analyst Day / March 12, 2021 / 2021 AT&T Intellectual Property - AT&T Proprietary
(6)
1,071
27,955
28,217
56,172
1,458
624
1,033
59,287
181,193
32.7%
181,193
(32,124)
3,092
1,672
153,833
1. Other is comprised of the Mobility, Broadband and Business Wireline business units in the Communications segments, the WarnerMedia and Latin America segments
and Corporate and Other. Income taxes, interest expense and other income (expense) - net are managed only on a total company basis and are, accordingly, reflected
only in the consolidated results.
59,287
(4,525)
1,518
56,280
36.6%
Net Debt to Adjusted EBITDA¹
Adjusted Annualized EBITDA
Total Debt
Less: Cash and Cash Equivalents
$
Dec 31, 2020
54,546
157,245
9,740
147,505
2.70
Net Debt
Net Debt to Adjusted EBITDA Ratio
1 As reported in AT&T's Form 8-K filed January 27, 2021 and July 24, 2018.
Jun 30, 2018
$ 63,414
190,167
13,523
176,644
2.79
AT&TView entire presentation