HSBC Results Presentation Deck
Capital adequacy
CET1 ratio, %
15.9
3Q21
CET1, $bn 133.2
RWAS, $bn 839.2
Capital progression
0.2
Profits
1.4
Common equity tier 1 capital, $bn
Reported risk-weighted assets, $bn
CET1 ratio³, %
Leverage ratio exposure, $bn
Leverage ratio³, %
(0.0)
0.0
Change FX translation
in RWAS differences
0.5
(0.1)
(1.4)
(0.0)
Other 39
(0.1)
4Q20
136.1
857.5
15.9
2,897.1
5.5
(0.2)
Dividend
and buyback
(1.8)
3Q21
133.2
839.2
15.9
2,964.8
5.2
15.8
4Q21
132.6
838.3
4Q21
132.6
838.3
15.8
2,962.7
5.2
Strategy
4021 results
Appendix
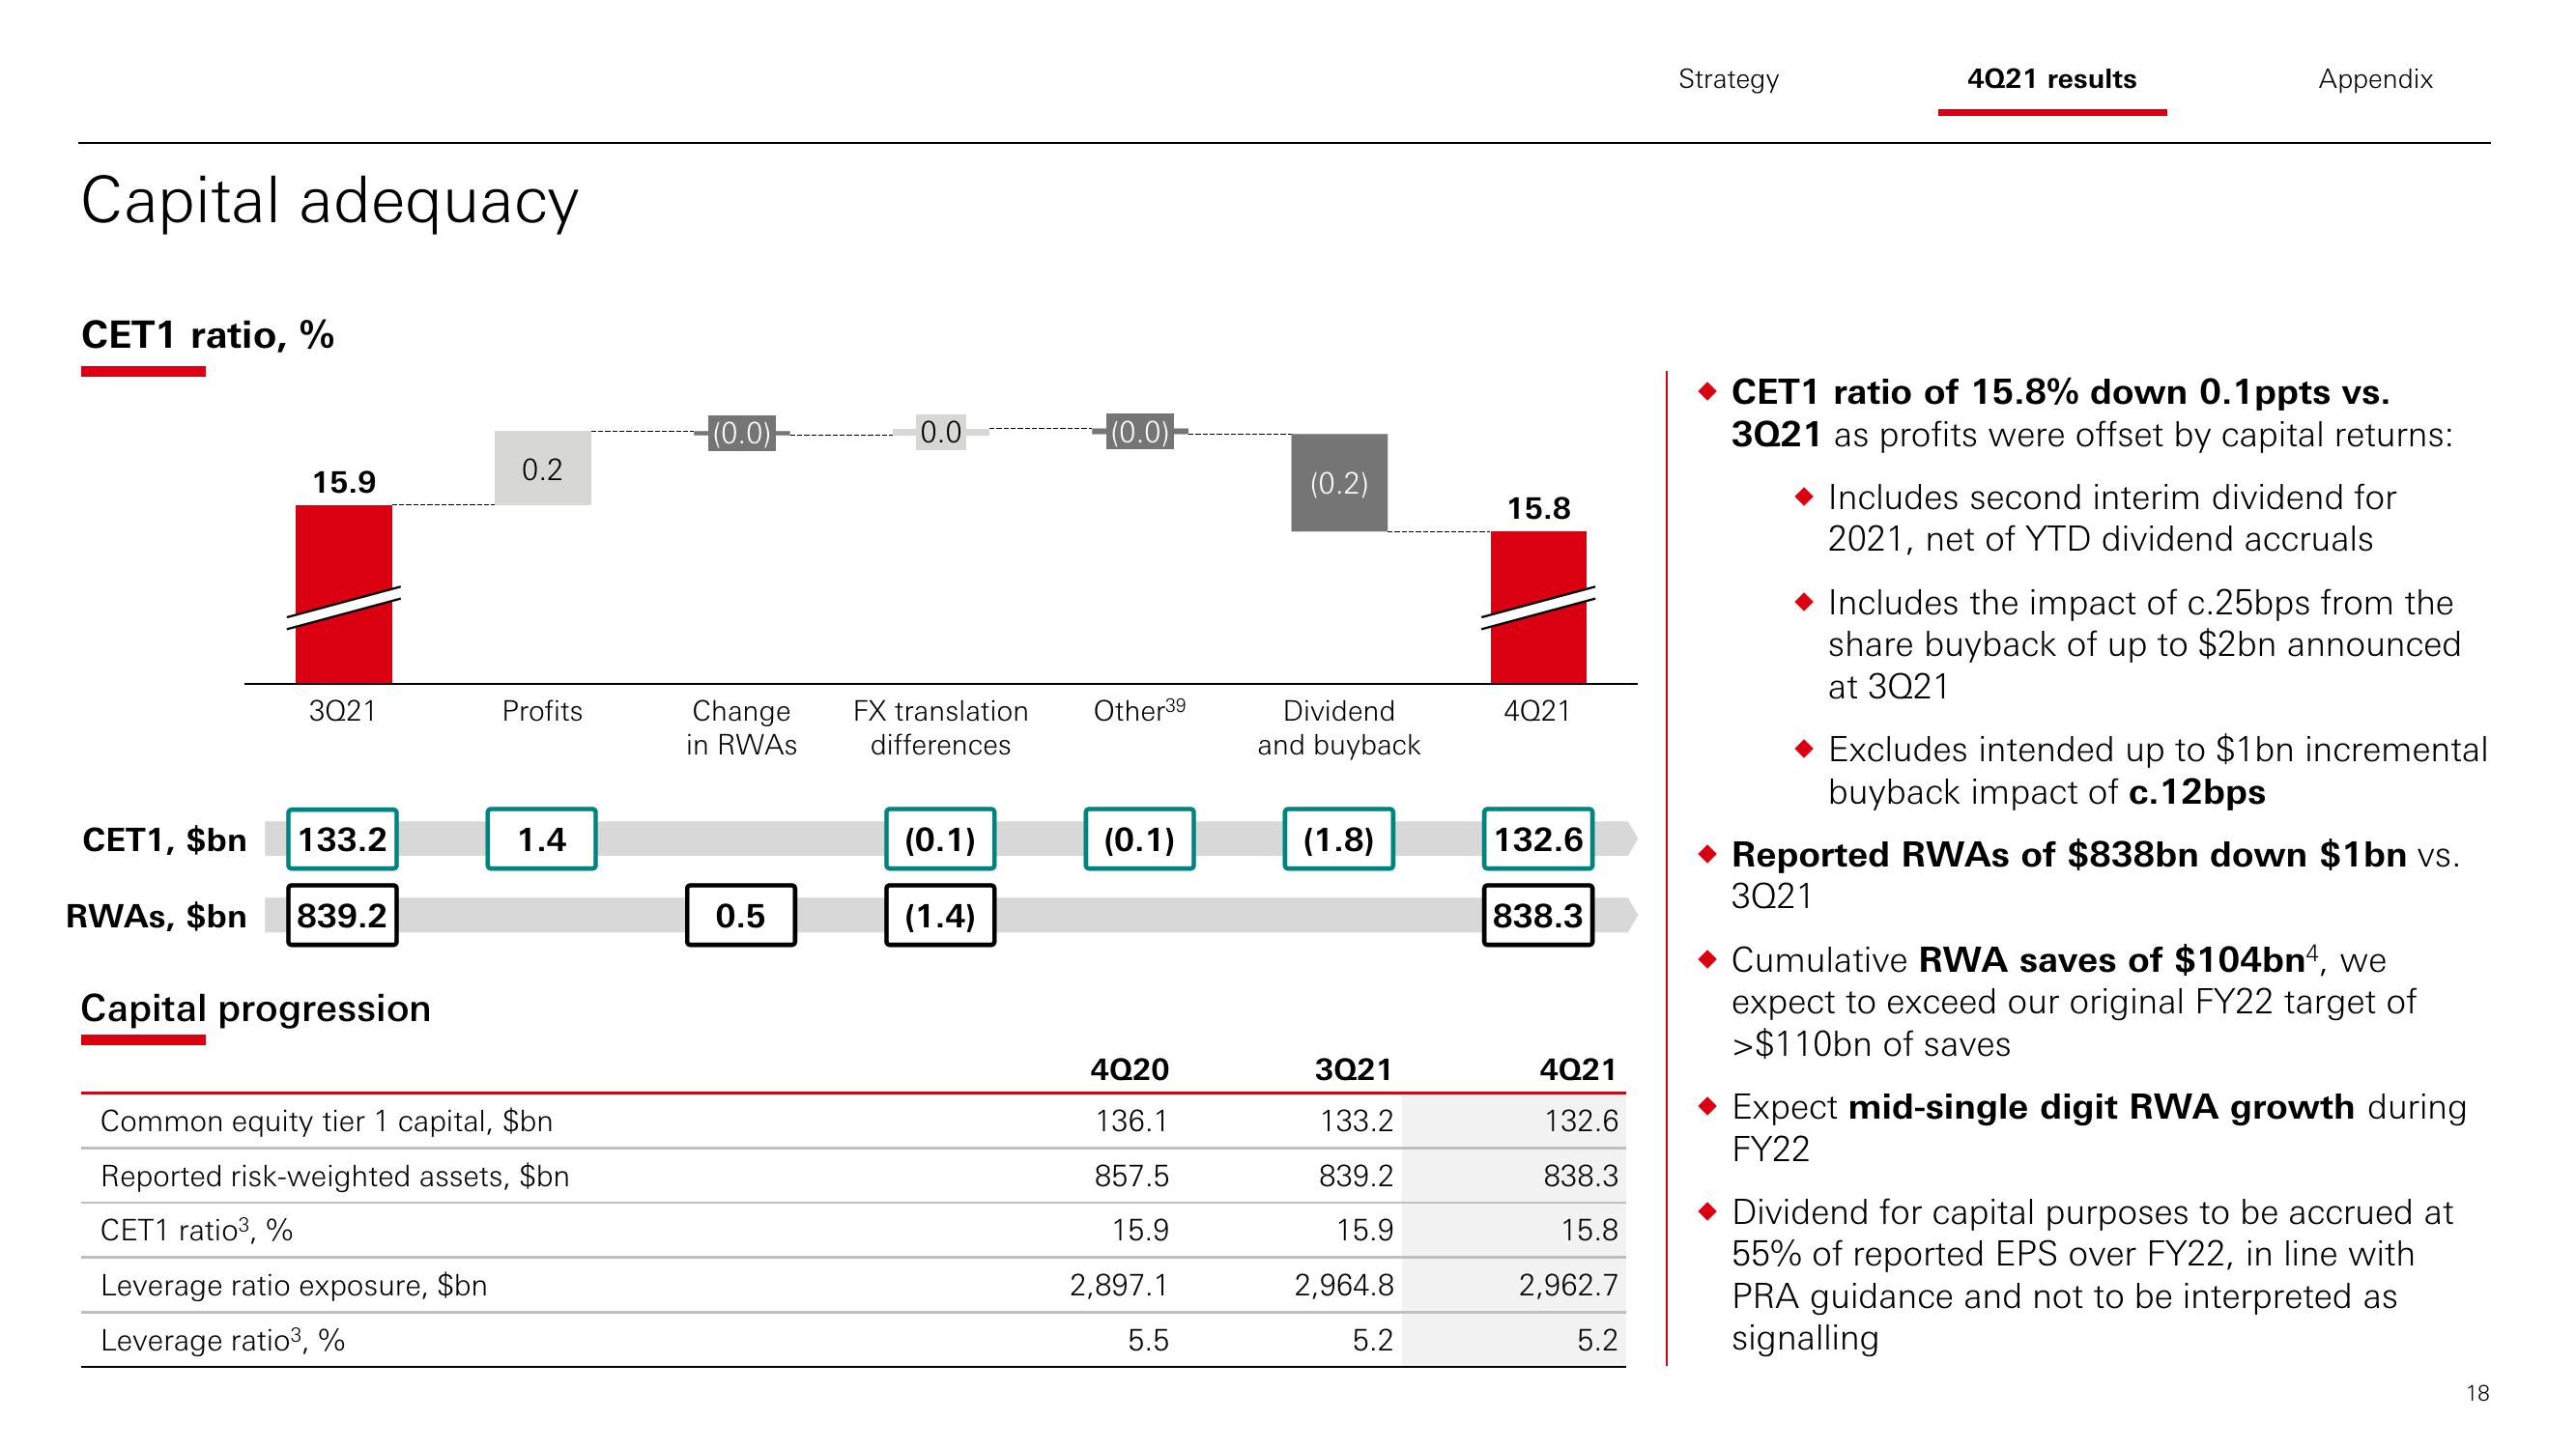
CET1 ratio of 15.8% down 0.1 ppts vs.
3021 as profits were offset by capital returns:
Includes second interim dividend for
2021, net of YTD dividend accruals
Includes the impact of c.25bps from the
share buyback of up to $2bn announced
at 3021
Excludes intended up to $1bn incremental
buyback impact of c.12bps
Reported RWAs of $838bn down $1bn vs.
3Q21
Cumulative RWA saves of $104bn4, we
expect to exceed our original FY22 target of
>$110bn of saves
Expect mid-single digit RWA growth during
FY22
Dividend for capital purposes to be accrued at
55% of reported EPS over FY22, in line with
PRA guidance and not to be interpreted as
signalling
18View entire presentation