Solar Industry Update
Quarterly PV Installed (GWac)
·
8
7
6
ம
2
0
U.S. Installation Breakdown
Quarterly: EIA (GWac)
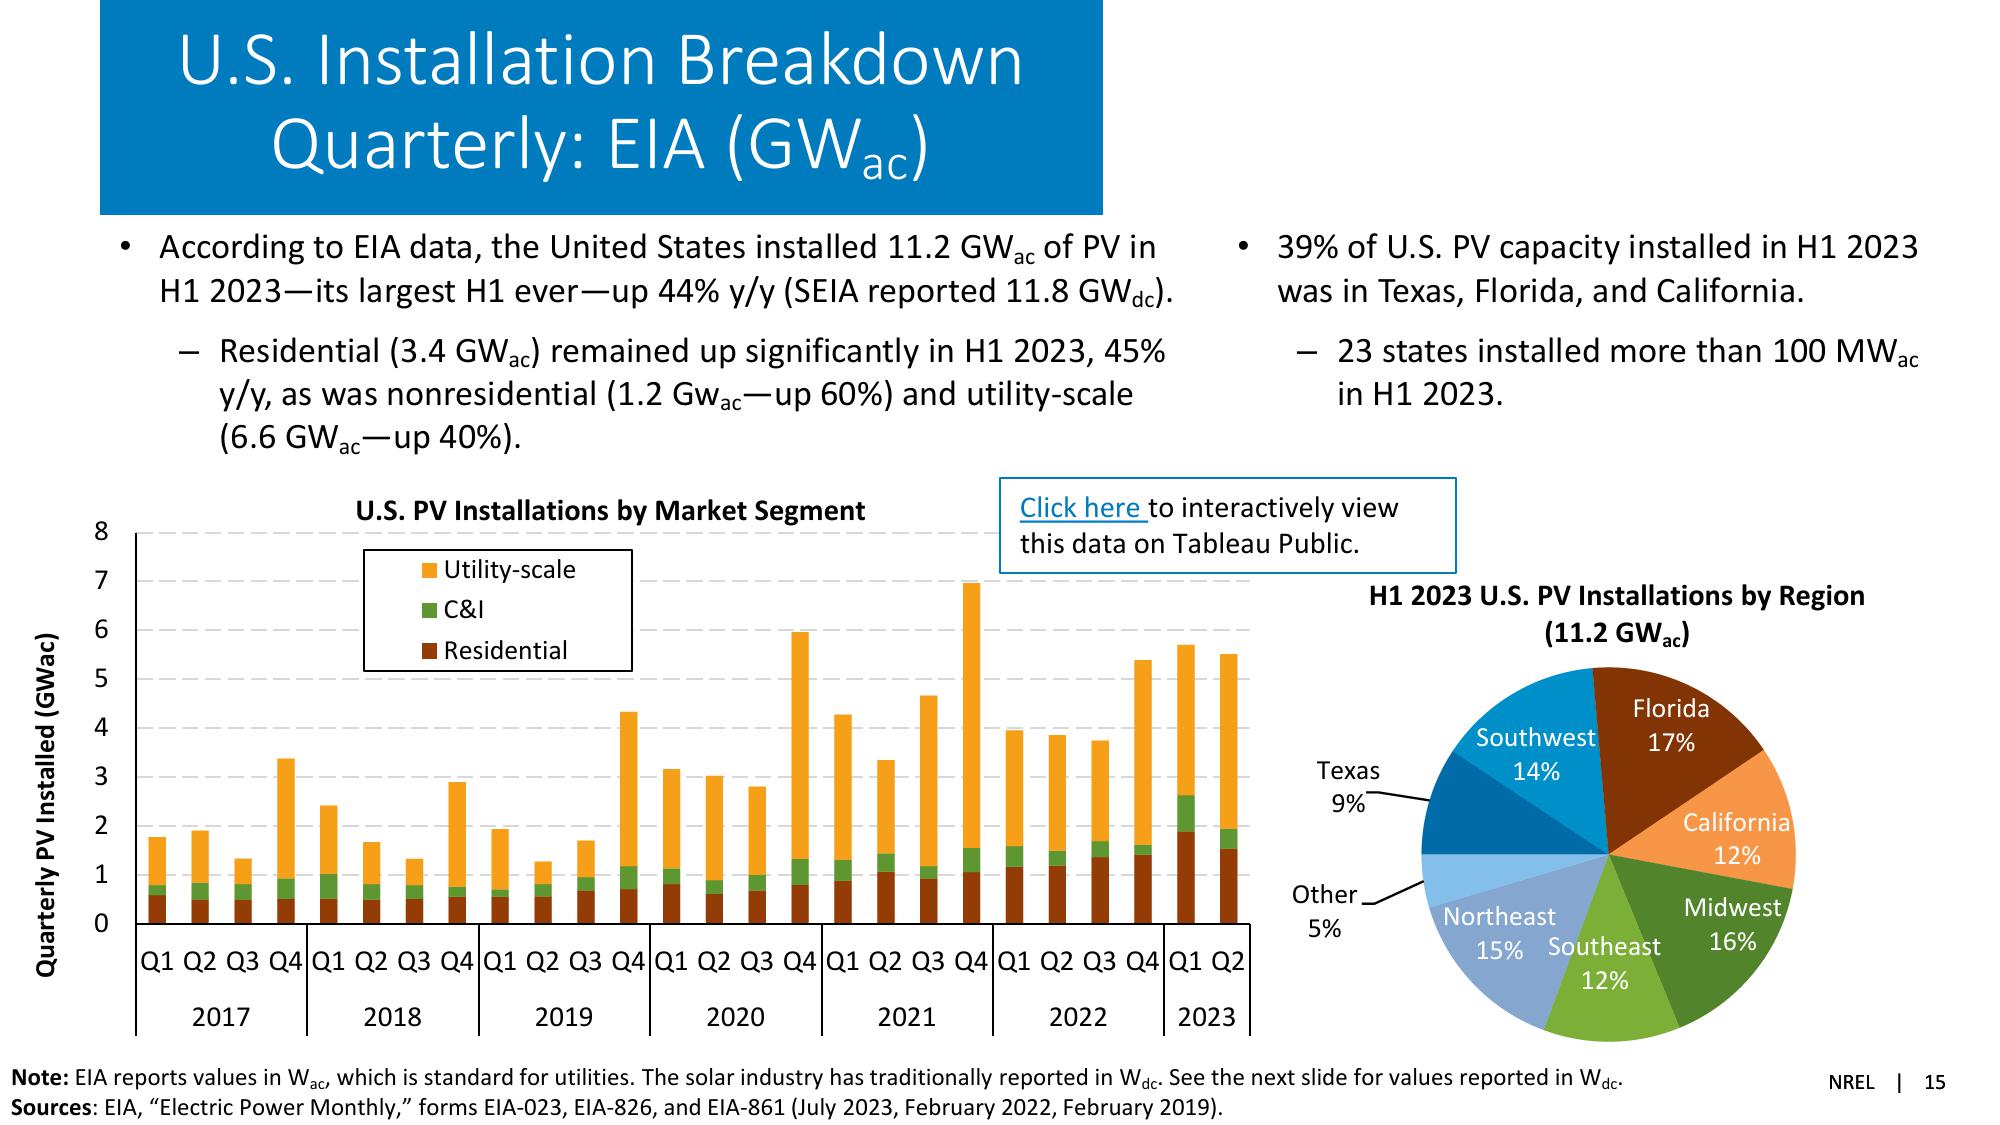
According to EIA data, the United States installed 11.2 GW ac of PV in
H1 2023-its largest H1 ever-up 44% y/y (SEIA reported 11.8 GWdc).
-
Residential (3.4 GWac) remained up significantly in H1 2023, 45%
y/y, as was nonresidential (1.2 Gwac-up 60%) and utility-scale
(6.6 GWac-up 40%).
•
39% of U.S. PV capacity installed in H1 2023
was in Texas, Florida, and California.
23 states installed more than 100 MW ac
in H1 2023.
U.S. PV Installations by Market Segment
Utility-scale
■C&I
■Residential
Click here to interactively view
this data on Tableau Public.
H1 2023 U.S. PV Installations by Region
(11.2 GWac)
Q1 Q2 Q3 Q4 Q1 Q2 Q3 Q4 Q1 Q2 Q3 Q4 Q1 Q2 Q3 Q4 Q1 Q2 Q3 Q4 Q1 Q2 Q3 Q4 Q1 Q2
2017
2018
2019
2020
2021
2022
2023
Texas
9%
Southwest
14%
Florida
17%
California
12%
Other
5%
Northeast
15% Southeast
12%
Midwest
16%
Note: EIA reports values in Wac, which is standard for utilities. The solar industry has traditionally reported in Wdc. See the next slide for values reported in Wdc.
Sources: EIA, "Electric Power Monthly," forms EIA-023, EIA-826, and EIA-861 (July 2023, February 2022, February 2019).
NREL 15View entire presentation