Maersk Results Presentation Deck
A.P. Moller Maersk Group
- Interim Report 02 2015
NOTE 5 SHARE CAPITAL
AND EARNINGS PER SHARE - CONTINUED
AMOUNTS IN USD MILLION
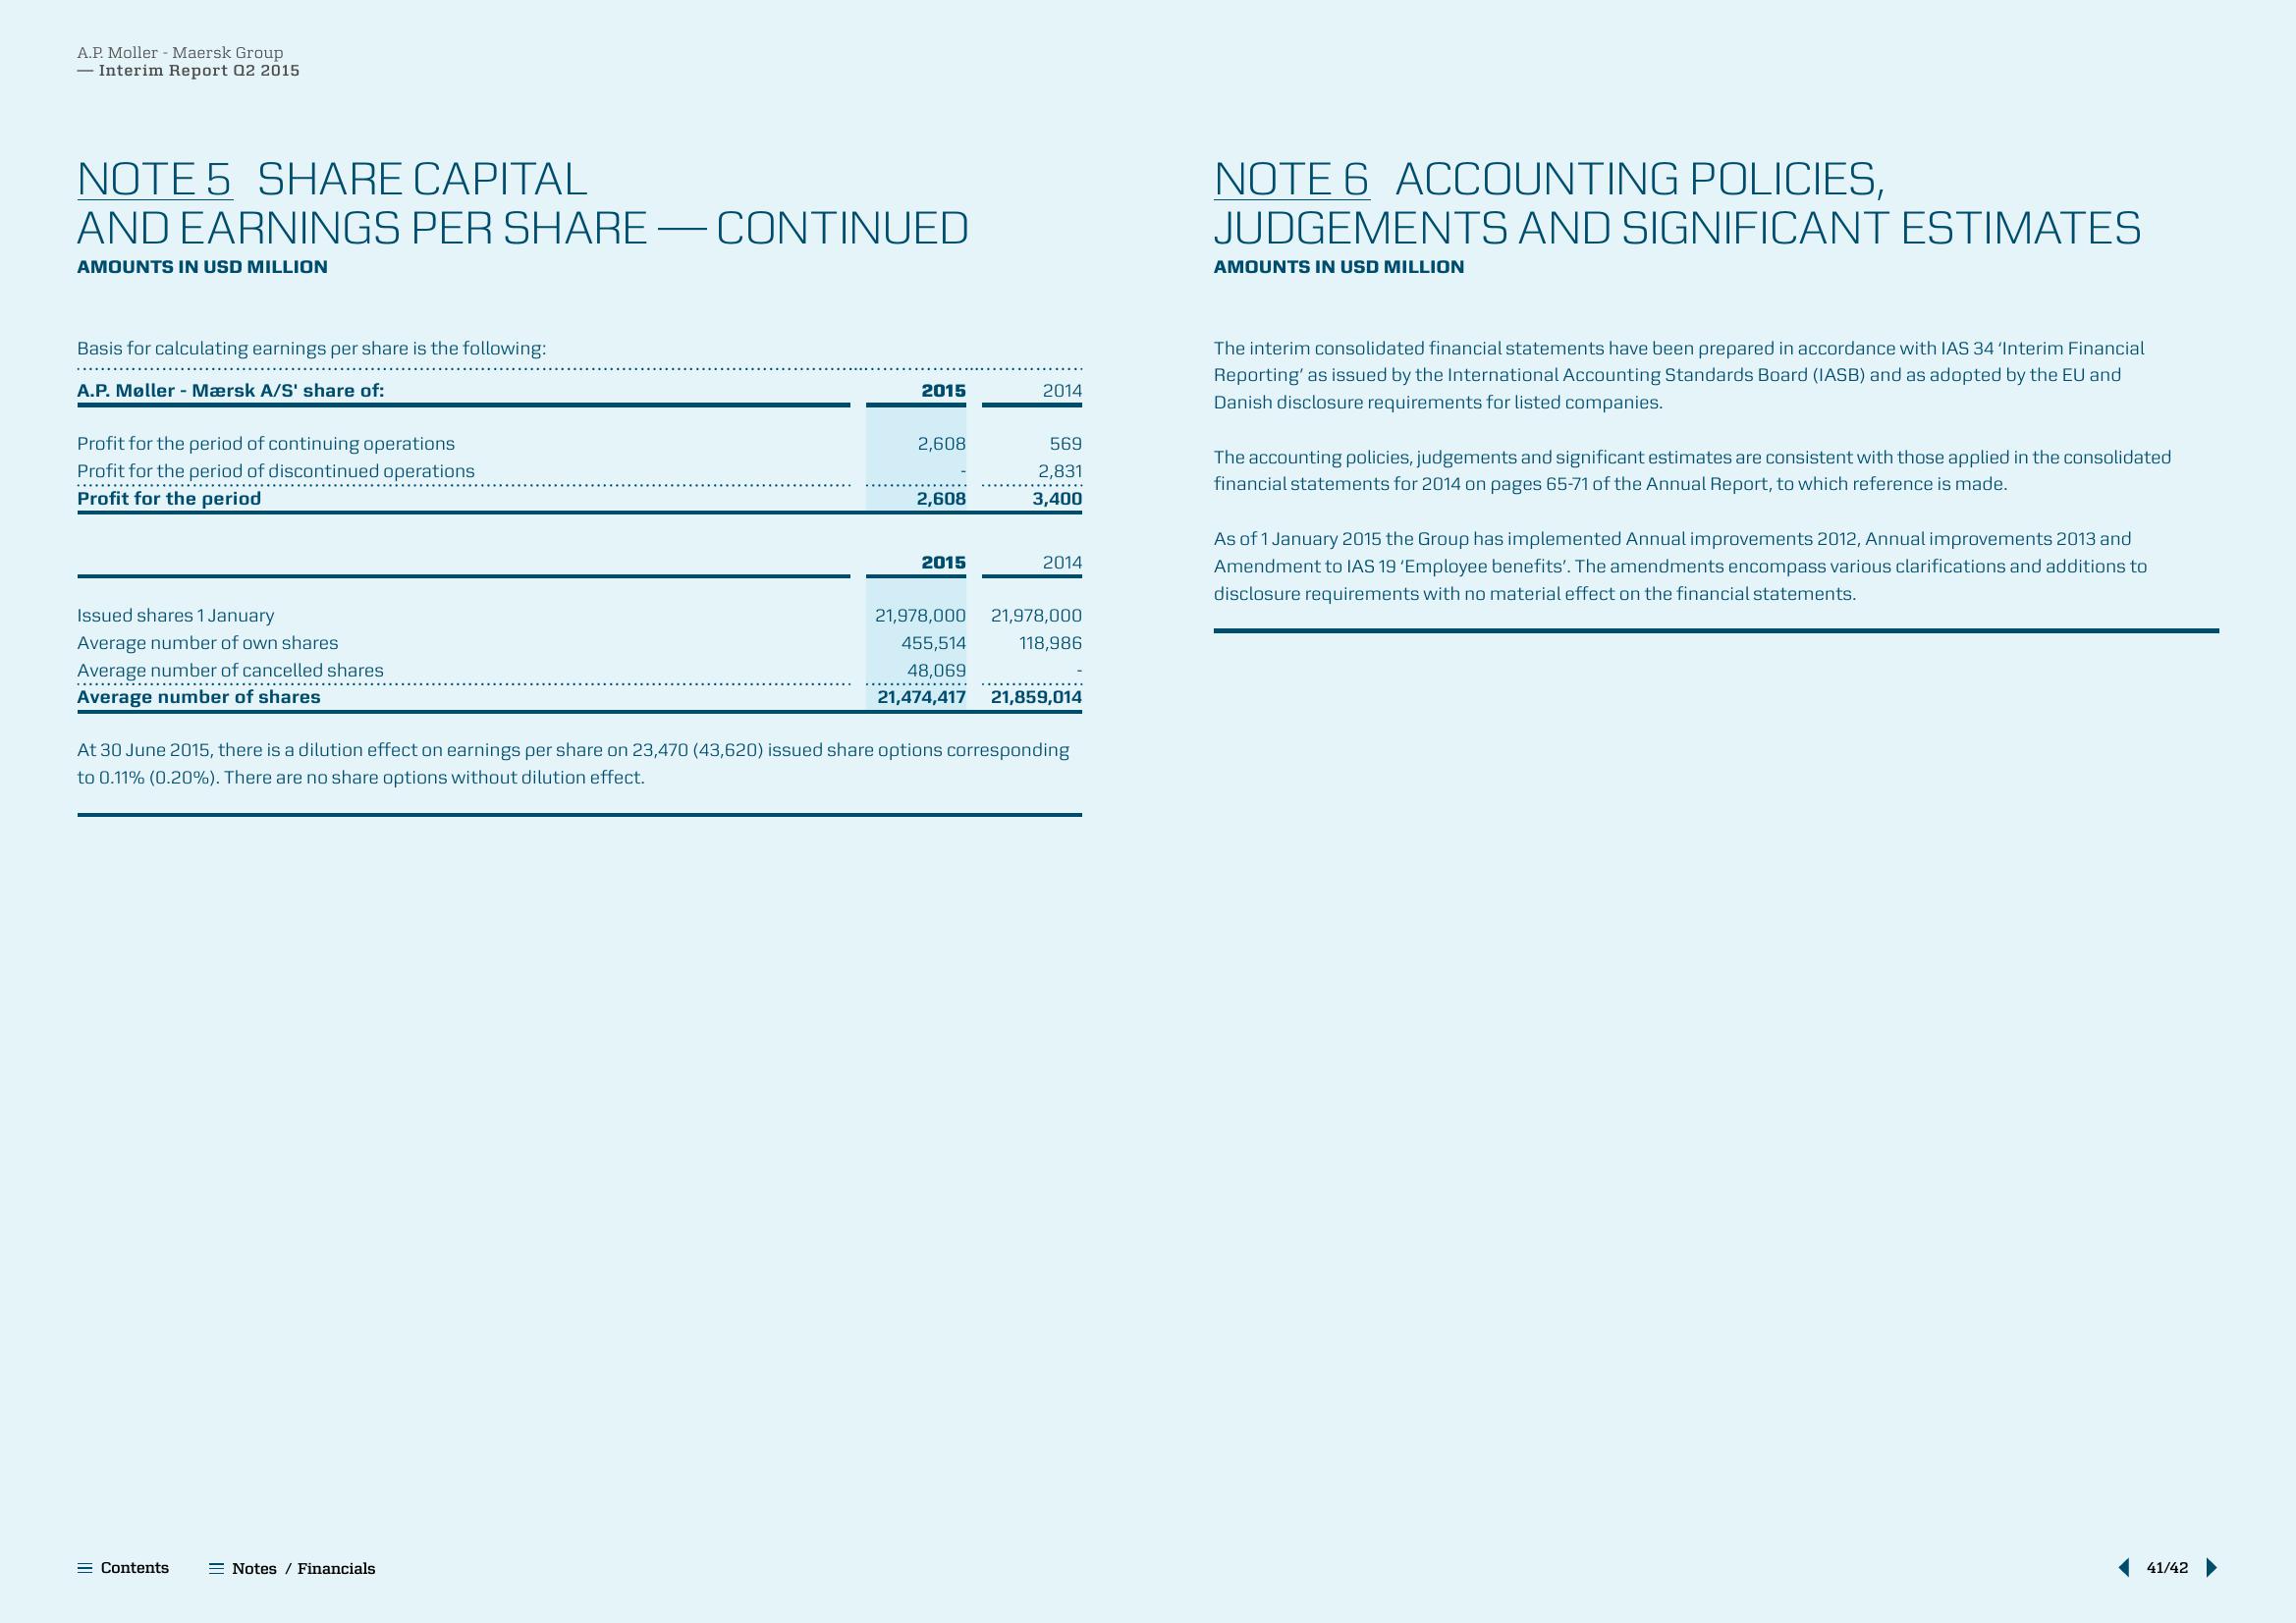
Basis for calculating earnings per share is the following:
A.P. Møller-Mærsk A/S' share of:
Profit for the period of continuing operations
Profit for the period of discontinued operations
Profit for the period
Issued shares 1 January
Average number of own shares.
Average number of cancelled shares
Average number of shares
= Contents
2015
Notes / Financials
2,608
2,608
2015
2014
569
2,831
3,400
2014
At 30 June 2015, there is a dilution effect on earnings per share on 23,470 (43,620) issued share options corresponding
to 0.11% (0.20%). There are no share options without dilution effect.
21,978,000 21,978,000
455,514
118,986
48,069
21,474,417 21,859,014
NOTE 6 ACCOUNTING POLICIES,
JUDGEMENTS AND SIGNIFICANT ESTIMATES
AMOUNTS IN USD MILLION
The interim consolidated financial statements have been prepared in accordance with IAS 34 'Interim Financial
Reporting' as issued by the International Accounting Standards Board (IASB) and as adopted by the EU and
Danish disclosure requirements for listed companies.
The accounting policies, judgements and significant estimates are consistent with those applied in the consolidated
financial statements for 2014 on pages 65-71 of the Annual Report, to which reference is made.
As of 1 January 2015 the Group has implemented Annual improvements 2012, Annual improvements 2013 and
Amendment to IAS 19 'Employee benefits'. The amendments encompass various clarifications and additions to
disclosure requirements with no material effect on the financial statements.
41/42 ▶View entire presentation