Overstock Results Presentation Deck
25.0%
20.0%
10.0%
15.0% 12.4%
5.0%
0.0%
-5.0%
-10.0%
overstock.com
-15.0%
Overstock contribution margin
Amazon contribution margin
Amazon product contribution margin (excludes service sales)
o Wayfair contribution margin
10.4%
-7.1%
11.9%
9.5%
-6.1%
Q3-12 Q4-12
12.9%
11.5%
O
5.5%
-7.2%
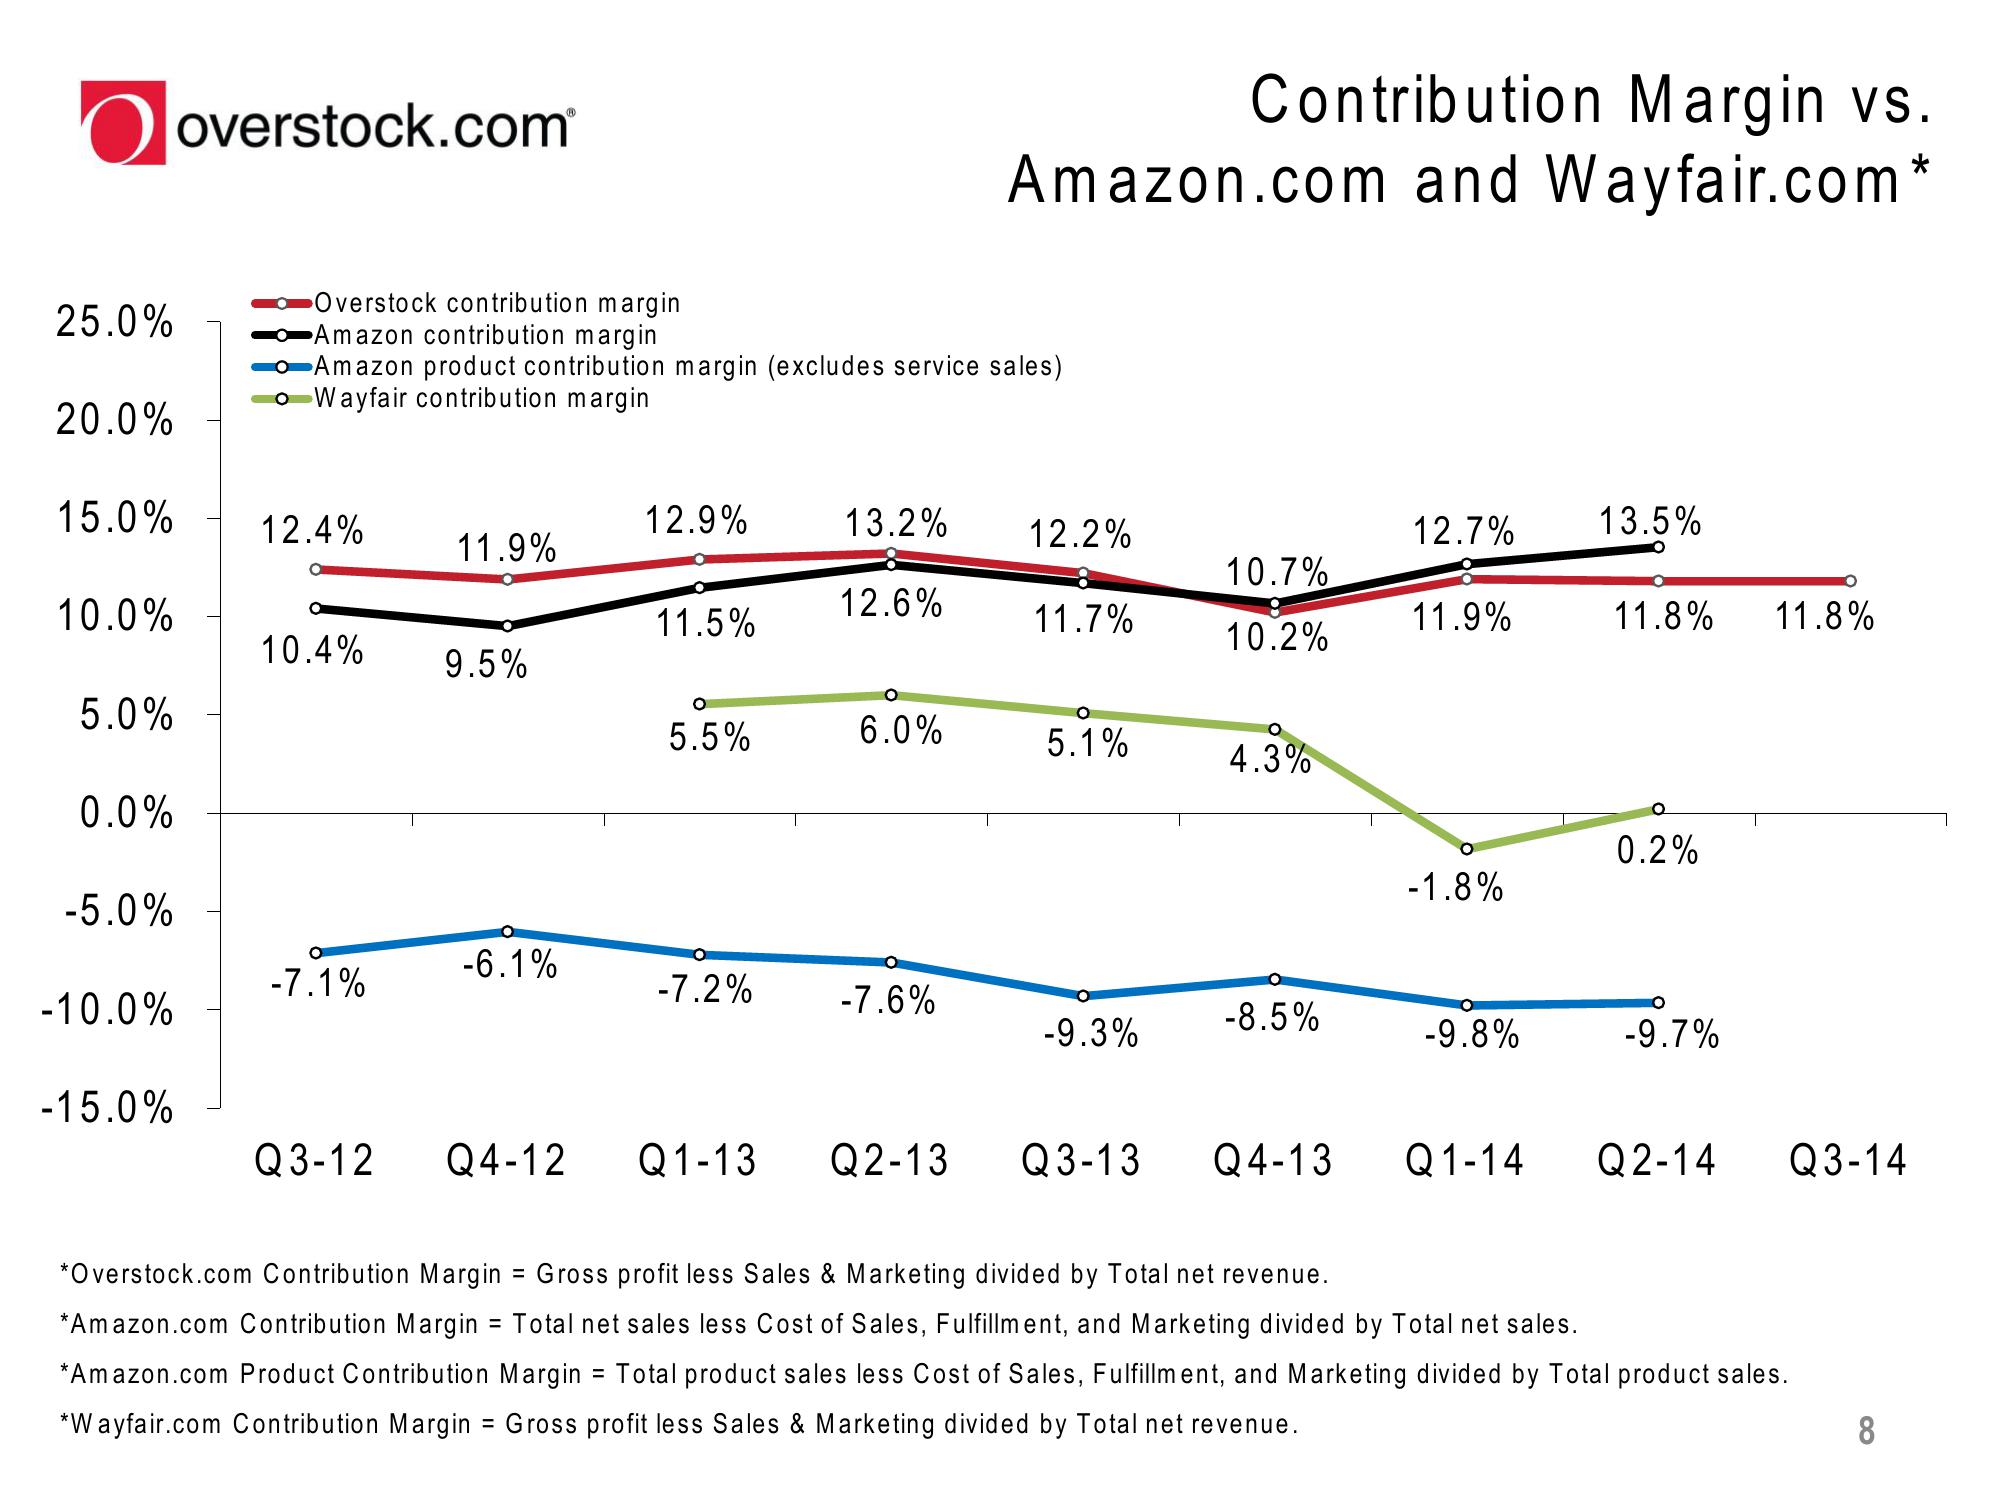
Contribution Margin vs.
Amazon.com and Wayfair.com*
13.2% 12.2%
12.6%
O
6.0%
-7.6%
11.7%
O
5.1%
-9.3%
10.7%
10.2%
O
4.3%
-8.5%
Q1-13 Q2-13 Q3-13 Q4-13
12.7%
11.9%
-1.8%
-9.8%
13.5%
11.8% 11.8%
0.2%
-9.7%
Q1-14 Q2-14 Q3-14
*Overstock.com Contribution Margin = Gross profit less Sales & Marketing divided by Total net revenue.
*Amazon.com Contribution Margin = Total net sales less Cost of Sales, Fulfillment, and Marketing divided by Total net sales.
*Amazon.com Product Contribution Margin = Total product sales less Cost of Sales, Fulfillment, and Marketing divided by Total product sales.
*Wayfair.com Contribution Margin = Gross profit less Sales & Marketing divided by Total net revenue.
8View entire presentation