Sonder Investor Presentation Deck
Non-GAAP Reconciliations
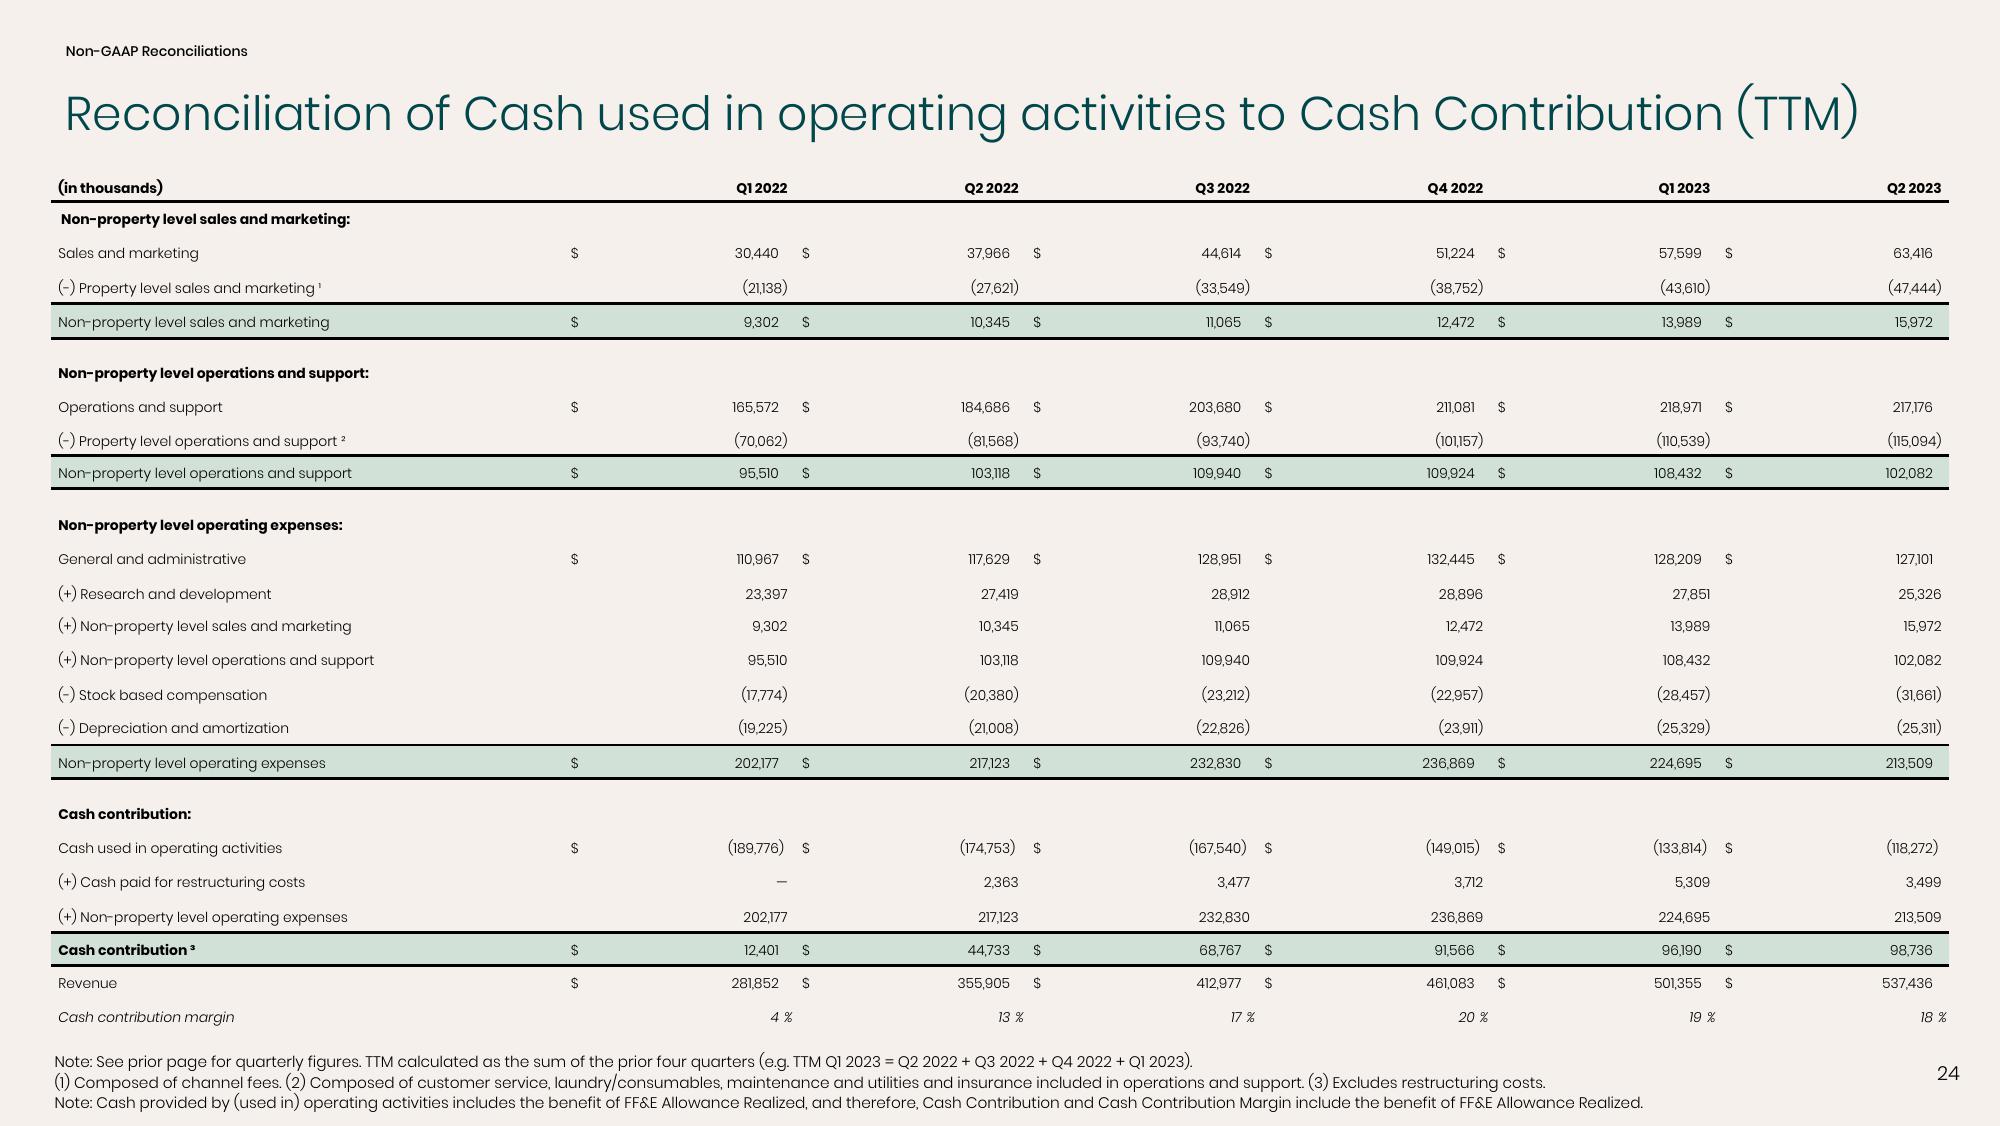
Reconciliation of Cash used in operating activities to Cash Contribution (TTM)
(in thousands)
Non-property level sales and marketing:
Sales and marketing
(-) Property level sales and marketing¹
Non-property level sales and marketing
Non-property level operations and support:
Operations and support
(-) Property level operations and support ²
Non-property level operations and support
Non-property level operating expenses:
General and administrative
(+) Research and development
(+) Non-property level sales and marketing
(+) Non-property level operations and support
(-) Stock based compensation
(-) Depreciation and amortization
Non-property level operating expenses
Cash contribution:
Cash used in operating activities
(+) Cash paid for restructuring costs
(+) Non-property level operating expenses
Cash contribution ³
Revenue
Cash contribution margin
$
$
$
$
$
$
$
$
Q1 2022
30,440 $
(21,138)
9,302 S
165,572
(70,062)
95,510
110,967
23,397
9,302
95,510
(17,774)
(19,225)
202,177
202,177 S
12,401
$
(189,776) S
281,852
S
4%
S
$
S
Q2 2022
37,966
(27,621)
10,345 $
184,686
117,629
(81,568)
103,118 $
27,419
10,345
103,118
(20,380)
(21,008)
217,123
$
2,363
217,123
$
(174,753) $
13 %
$
$
44,733 $
355.905 $
Q3 2022
44,614
(33,549)
11,065
203,680
(93,740)
109,940
128,951
28,912
11,065
109,940
(23,212)
(22,826)
232,830
3,477
232,830
68,767
412,977
$
17%
$
$
$
(167,540) $
$
$
$
$
Q4 2022
51,224
(38,752)
12,472
211,081
(101,157)
109,924
132,445
28,896
12,472
109,924
(22,957)
(23,911)
3,712
236,869
91,566
$
236,869 $
461,083
$
(149,015) $
20 %
$
$
$
$
$
Note: See prior page for quarterly figures. TTM calculated as the sum of the prior four quarters (e.g. TTM Q1 2023 = Q2 2022+Q3 2022 + Q4 2022 + Q1 2023).
(1) Composed of channel fees. (2) Composed of customer service, laundry/consumables, maintenance and utilities and insurance included in operations and support. (3) Excludes restructuring costs.
Note: Cash provided by (used in) operating activities includes the benefit of FF&E Allowance Realized, and therefore, Cash Contribution and Cash Contribution Margin include the benefit of FF&E Allowance Realized.
Q1 2023
57,599
(43,610)
13,989 S
218,971 $
(110,539)
108,432
128,209
27,851
13,989
108,432
(28,457)
(25,329)
224,695
S
224,695
96,190
501,355
19 %
S
(133,814) S
5,309
$
S
S
S
Q2 2023
63,416
(47,444)
15,972
217,176
(115,094)
102,082
127,101
25,326
15,972
102,082
(31,661)
(25,311)
213,509
(118,272)
3,499
213,509
98,736
537,436
18%
24View entire presentation