Antero Midstream Partners Investor Presentation Deck
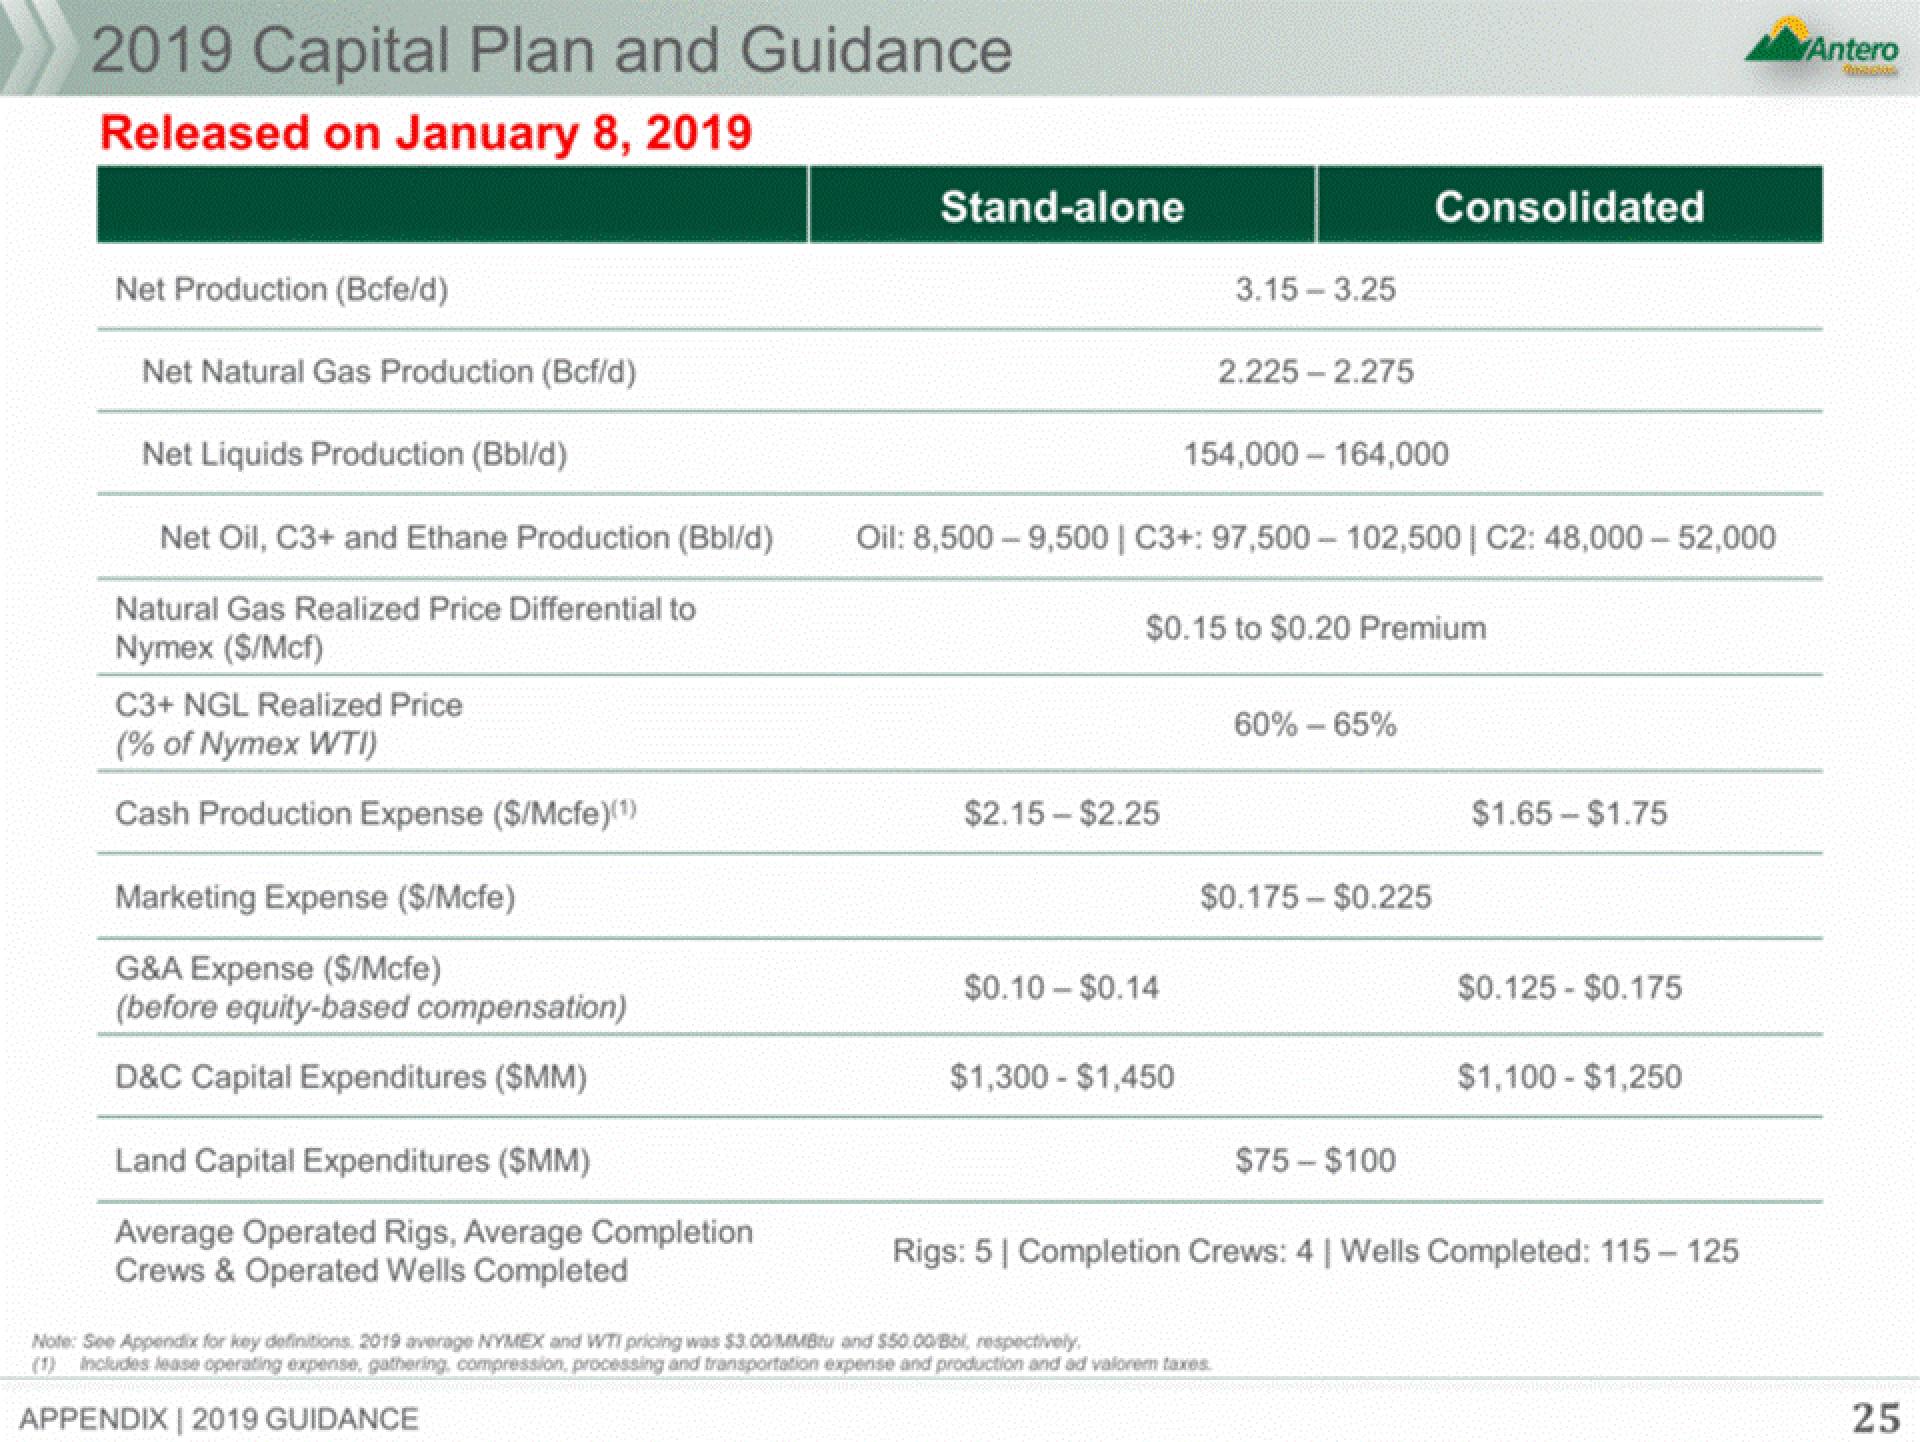
2019 Capital Plan and Guidance
Released on January 8, 2019
C3+ NGL Realized Price
(% of Nymex WTI)
Cash Production Expense ($/Mcfe)(¹)
Net Production (Bcfe/d)
Net Natural Gas Production (Bcf/d)
Net Liquids Production (Bbl/d)
Net Oil, C3+ and Ethane Production (Bbl/d) Oil: 8,500-9,500 | C3+: 97,500-102,500 | C2: 48,000-52,000
Natural Gas Realized Price Differential to
Nymex (S/Mcf)
Marketing Expense ($/Mcfe)
G&A Expense ($/Mcfe)
(before equity-based compensation)
D&C Capital Expenditures ($MM)
Stand-alone
Land Capital Expenditures ($MM)
Average Operated Rigs, Average Completion
Crews & Operated Wells Completed
$2.15 - $2.25
$0.10 $0.14
$1,300 $1,450
3.15 3.25
$0.15 to $0.20 Premium
2.225-2.275
154,000 164,000
Note: See Appendix for key definitions 2019 average NYMEX and WTI pricing was $3.00/MMB and $50.00/Bbl, respectively.
(1) Includes lease operating expense, gathering, compression, processing and transportation expense and production and ad valorem taxes.
APPENDIX | 2019 GUIDANCE
Consolidated
60% - 65%
$0.175$0.225
$75 - $100
$1.65 $1.75
$0.125 $0.175
$1,100 $1,250
Rigs: 5 | Completion Crews: 4 | Wells Completed: 115-125
Antero
THEBOS
25View entire presentation