First Merchants Results Presentation Deck
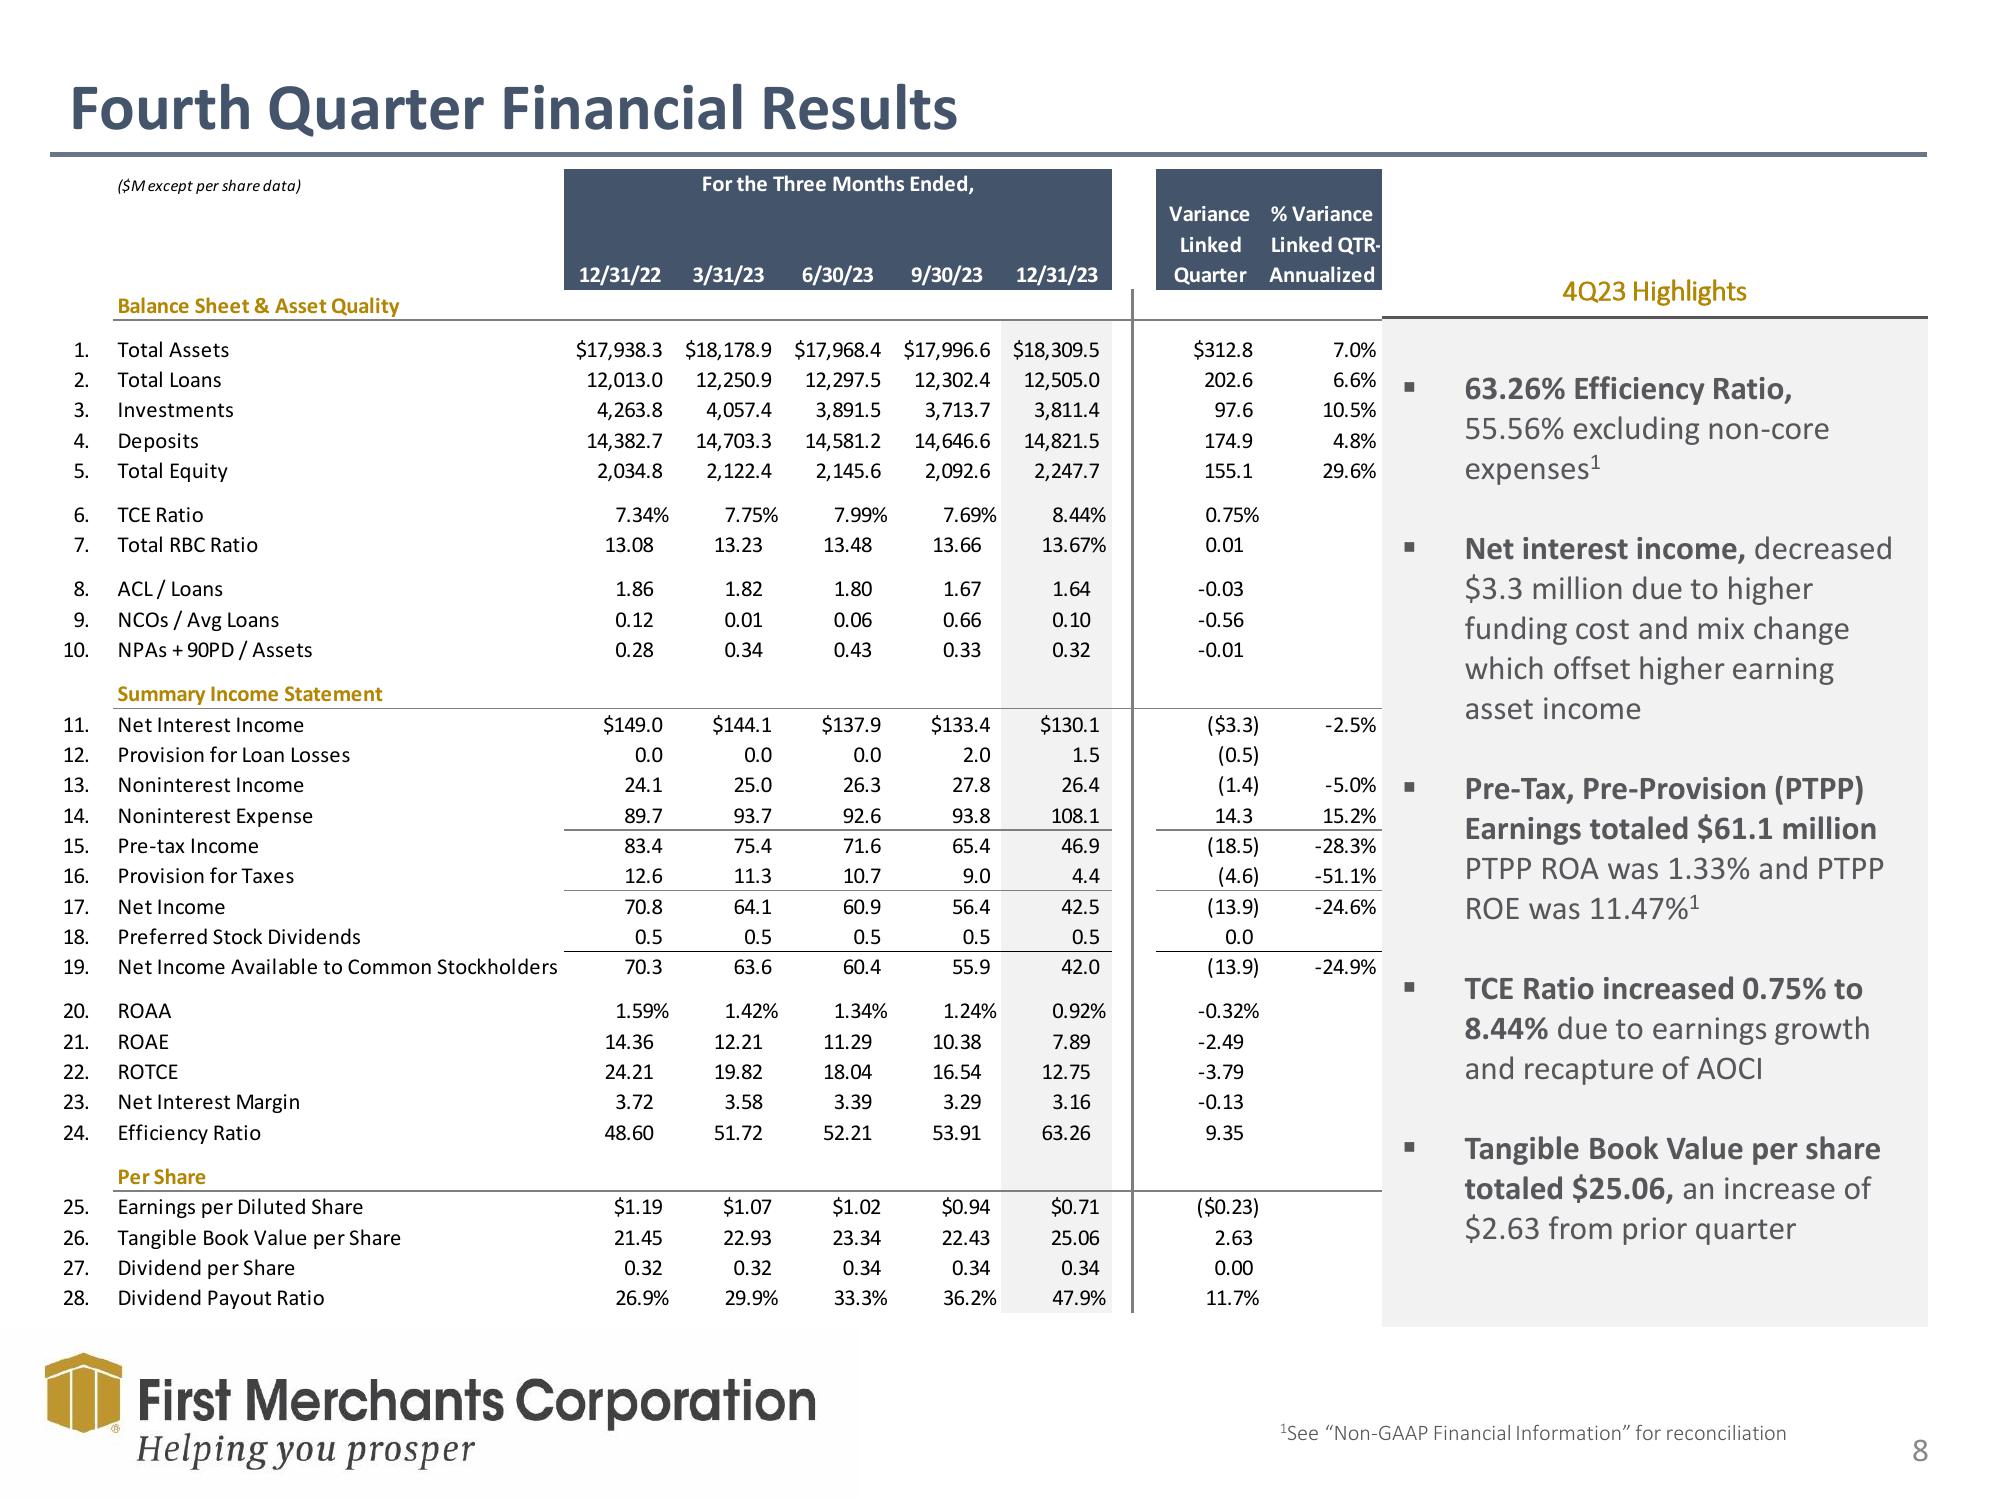
Fourth Quarter Financial Results
1. Total Assets
Total Loans
Investments
6.
7.
($M except per share data)
2.
3.
4. Deposits
5. Total Equity
8.
9.
10.
Balance Sheet & Asset Quality
25.
26.
27.
28.
TCE Ratio
Total RBC Ratio
ACL / Loans
NCOS / Avg Loans
NPAS +90PD / Assets
Summary Income Statement
Net Interest Income
Provision for Loan Losses
11.
12.
13. Noninterest Income
14. Noninterest Expense
15.
Pre-tax Income
16.
Provision for Taxes
17.
Net Income
18.
Preferred Stock Dividends
19. Net Income Available to Common Stockholders
20. ROAA
21. ROAE
22.
ROTCE
23.
Net Interest Margin
24.
Efficiency Ratio
Per Share
Earnings per Diluted Share
Tangible Book Value per Share
Dividend per Share
Dividend Payout Ratio
12/31/22 3/31/23 6/30/23 9/30/23
7.34%
$17,938.3 $18,178.9 $17,968.4 $17,996.6 $18,309.5
12,013.0 12,250.9 12,297.5 12,302.4 12,505.0
4,263.8 4,057.4 3,891.5 3,713.7 3,811.4
14,382.7 14,703.3 14,581.2 14,646.6 14,821.5
2,034.8 2,122.4 2,145.6 2,092.6 2,247.7
13.08
1.86
0.12
0.28
$149.0
0.0
24.1
89.7
83.4
12.6
70.8
0.5
70.3
1.59%
For the Three Months Ended,
14.36
24.21
3.72
48.60
$1.19
21.45
0.32
26.9%
7.75%
13.23
1.82
0.01
0.34
$144.1
0.0
25.0
93.7
75.4
11.3
64.1
0.5
63.6
1.42%
12.21
19.82
3.58
51.72
$1.07
22.93
0.32
29.9%
First Merchants Corporation
Helping you prosper
7.99%
13.48
1.80
0.06
0.43
$137.9
0.0
26.3
92.6
71.6
10.7
60.9
0.5
60.4
1.34%
11.29
18.04
3.39
52.21
$1.02
23.34
0.34
33.3%
7.69%
13.66
1.67
0.66
0.33
$133.4
2.0
27.8
93.8
65.4
9.0
56.4
0.5
55.9
1.24%
10.38
16.54
3.29
53.91
12/31/23
$0.94
22.43
0.34
36.2%
8.44%
13.67%
1.64
0.10
0.32
$130.1
1.5
26.4
108.1
46.9
4.4
42.5
0.5
42.0
0.92%
7.89
12.75
3.16
63.26
$0.71
25.06
0.34
47.9%
Variance
% Variance
Linked Linked QTR-
Quarter Annualized
$312.8
202.6
97.6
174.9
155.1
0.75%
0.01
-0.03
-0.56
-0.01
($3.3)
(0.5)
(1.4)
14.3
(18.5)
(4.6)
(13.9)
0.0
(13.9)
-0.32%
-2.49
-3.79
-0.13
9.35
($0.23)
2.63
0.00
11.7%
7.0%
6.6%
10.5%
4.8%
29.6%
-2.5%
-5.0%
15.2%
-28.3%
-51.1%
-24.6%
-24.9%
■
■
■
■
M
4Q23 Highlights
63.26% Efficiency Ratio,
55.56% excluding non-core
expenses¹
Net interest income, decreased
$3.3 million due to higher
funding cost and mix change
which offset higher earning
asset income
Pre-Tax, Pre-Provision (PTPP)
Earnings totaled $61.1 million
PTPP ROA was 1.33% and PTPP
ROE was 11.47%¹
TCE Ratio increased 0.75% to
8.44% due to earnings growth
and recapture of AOCI
Tangible Book Value per share
totaled $25.06, an increase of
$2.63 from prior quarter
¹See "Non-GAAP Financial Information" for reconciliation
8View entire presentation