Klaviyo IPO Presentation Deck
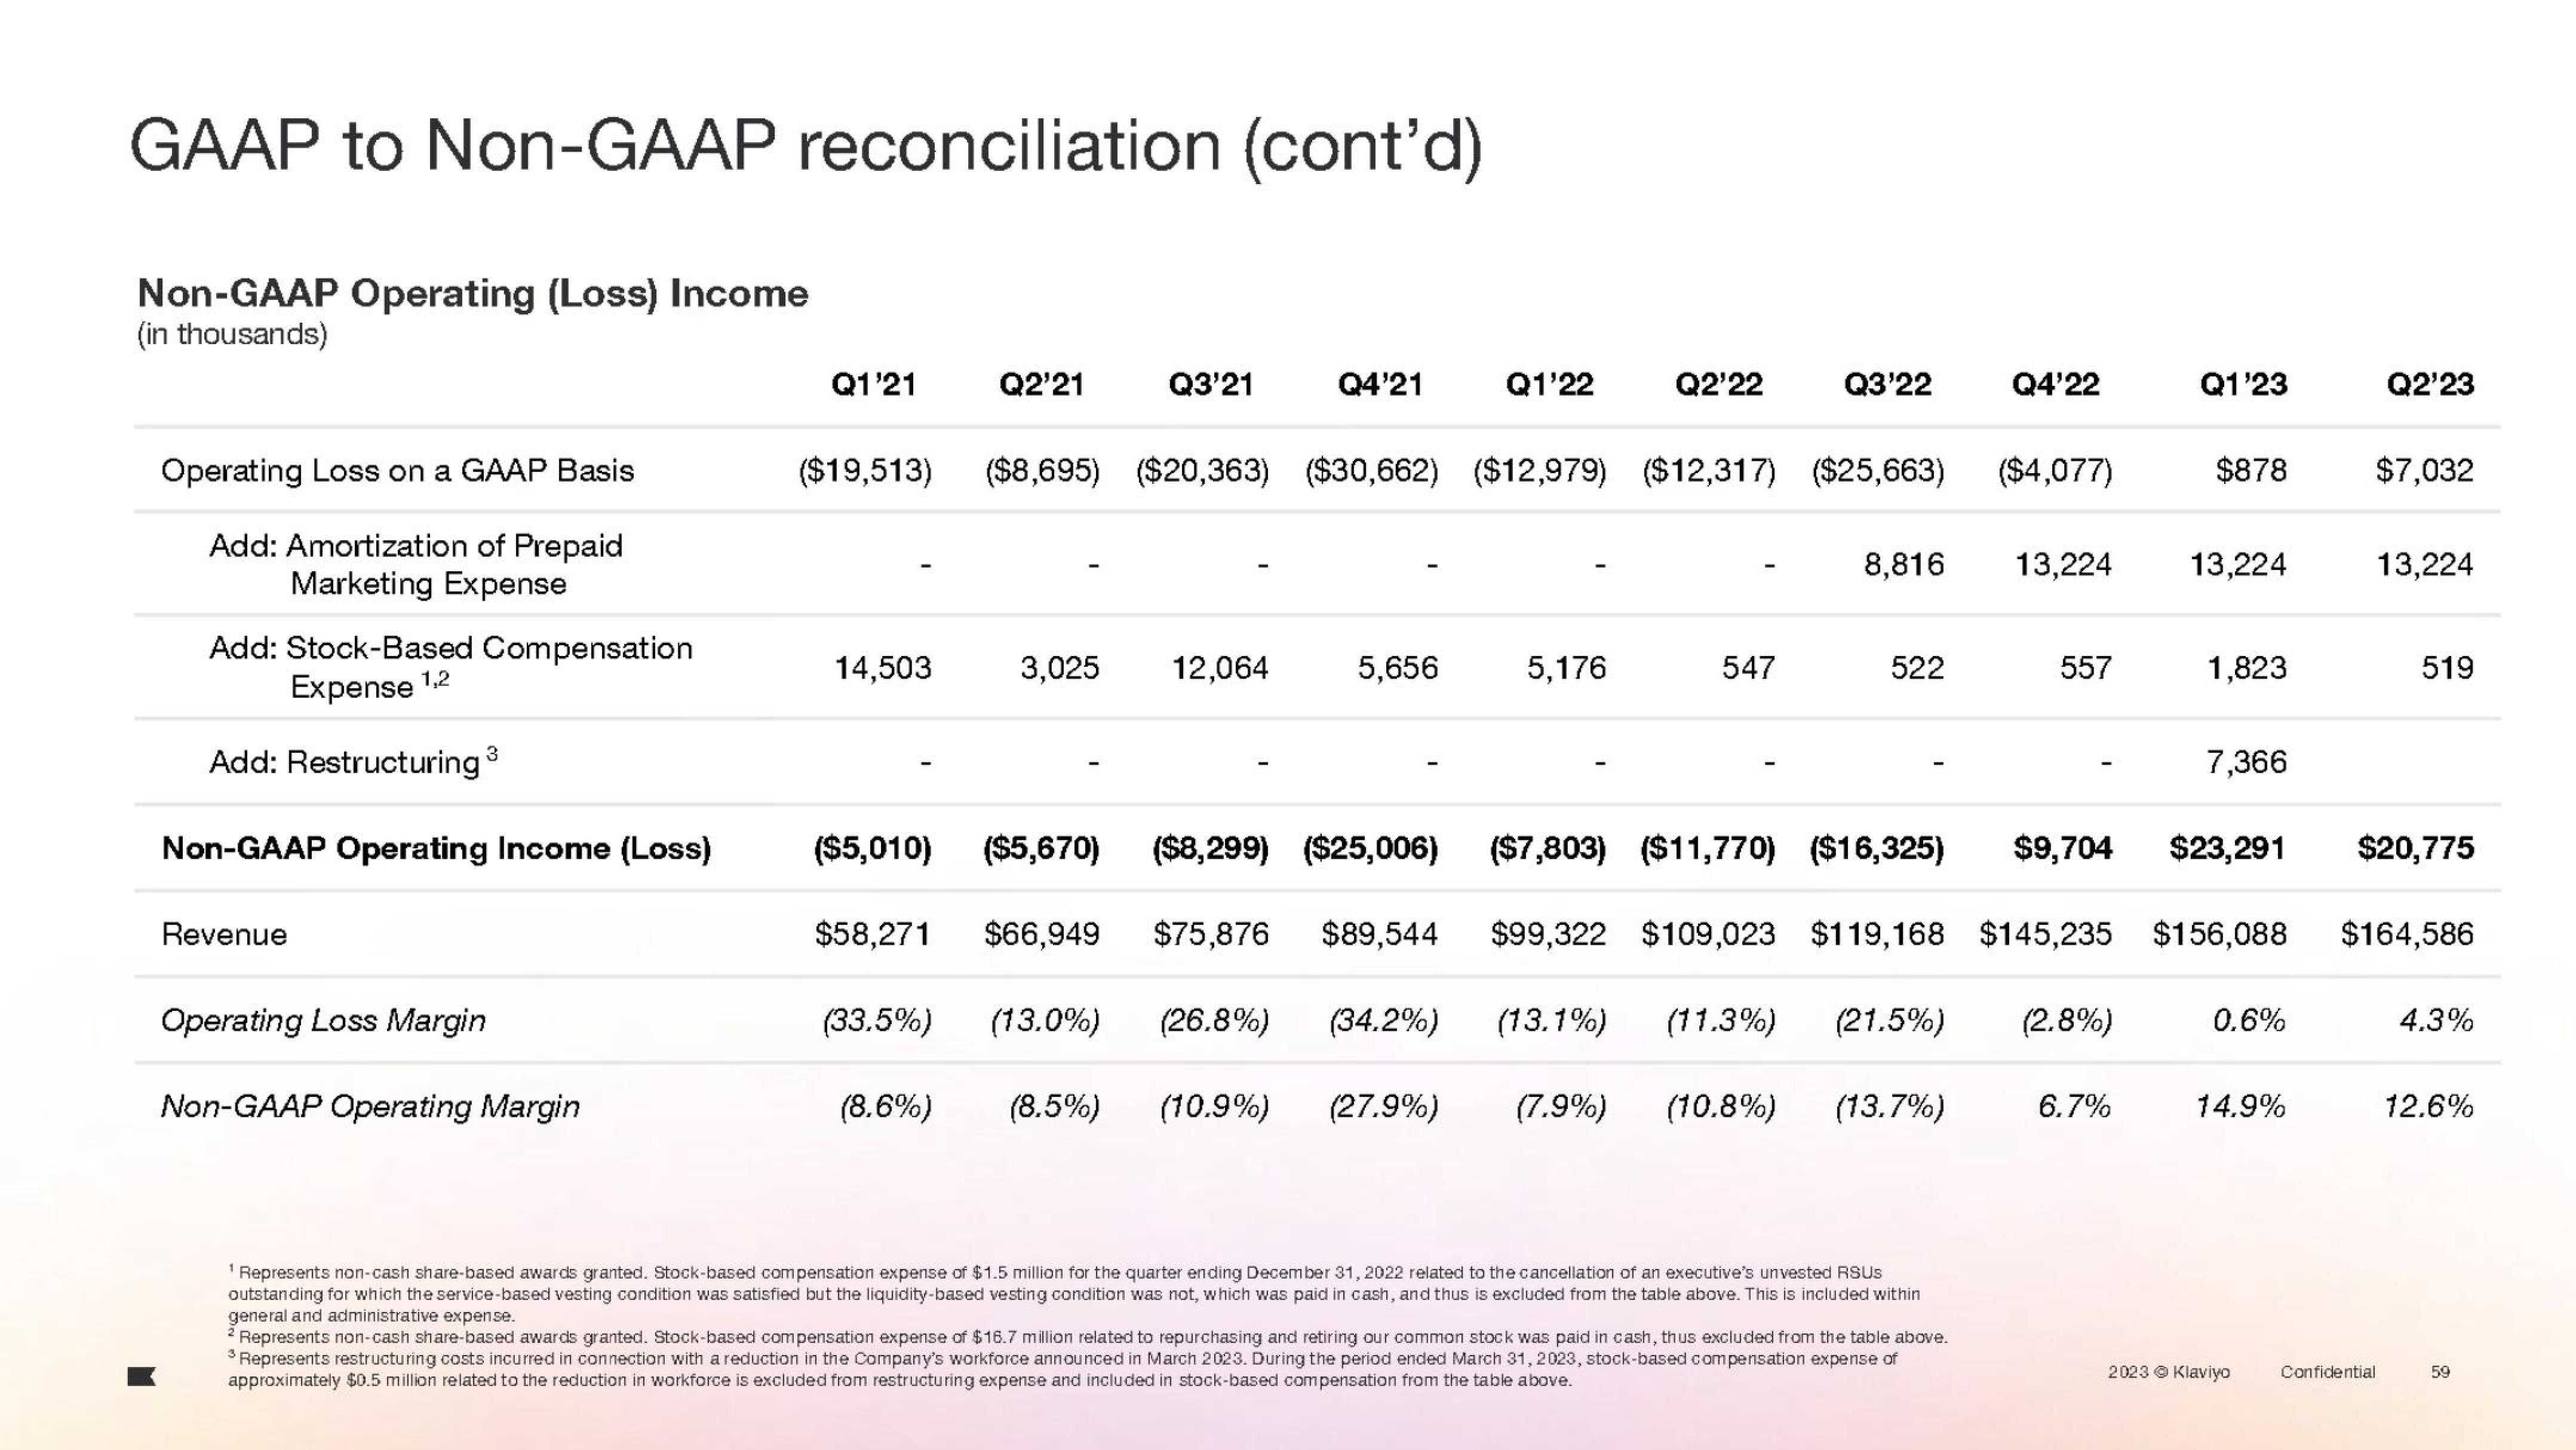
GAAP to Non-GAAP reconciliation (cont'd)
Non-GAAP Operating (Loss) Income
(in thousands)
Operating Loss on a GAAP Basis
Add: Amortization of Prepaid
Marketing Expense
Add: Stock-Based Compensation
Expense 1,2
Add: Restructuring ³
3
Non-GAAP Operating Income (Loss)
Revenue
Operating Loss Margin
Non-GAAP Operating Margin
Q1'21
14,503
Q2'21
(33.5%)
Q3'21
3,025 12,064
($19,513) ($8,695) ($20,363) ($30,662) ($12,979) ($12,317) ($25,663)
(13.0%)
(8.6%) (8.5%)
Q4'21
(26.8%)
(10.9%)
5,656
Q1'22
(34.2%)
(27.9%)
Q2'22
5,176
Q3'22
547
8,816
522
¹ Represents non-cash share-based awards granted. Stock-based compensation expense of $1.5 million for the quarter ending December 31, 2022 related to the cancellation of an executive's unvested RSUS
outstanding for which the service-based vesting condition was satisfied but the liquidity-based vesting condition was not, which was paid in cash, and thus is excluded from the table above. This is included within
general and administrative expense.
Q4'22
2 Represents non-cash share-based awards granted. Stock-based compensation expense of $16.7 million related to repurchasing and retiring our common stock was paid in cash, thus excluded from the table above.
3 Represents restructuring costs incurred in connection with a reduction in the Company's workforce announced in March 2023. During the period ended March 31, 2023, stock-based compensation expense of
approximately $0.5 million related to the reduction in workforce is excluded from restructuring expense and included in stock-based compensation from the table above.
($4,077)
557
$20,775
($5,010) ($5,670) ($8,299) ($25,006) ($7,803) ($11,770) ($16,325) $9,704 $23,291
$99,322 $109,023 $119,168 $145,235 $156,088 $164,586
$58,271 $66,949 $75,876 $89,544
(13.1%) (11.3%) (21.5%) (2.8%)
(7.9%) (10.8%) (13.7%)
Q1'23
13,224 13,224
$878
6.7%
1,823
7,366
0.6%
14.9%
2023 Ⓒ Klaviyo
Q2'23
$7,032
Confidential
13,224
519
4.3%
12.6%
59View entire presentation