Allwyn Results Presentation Deck
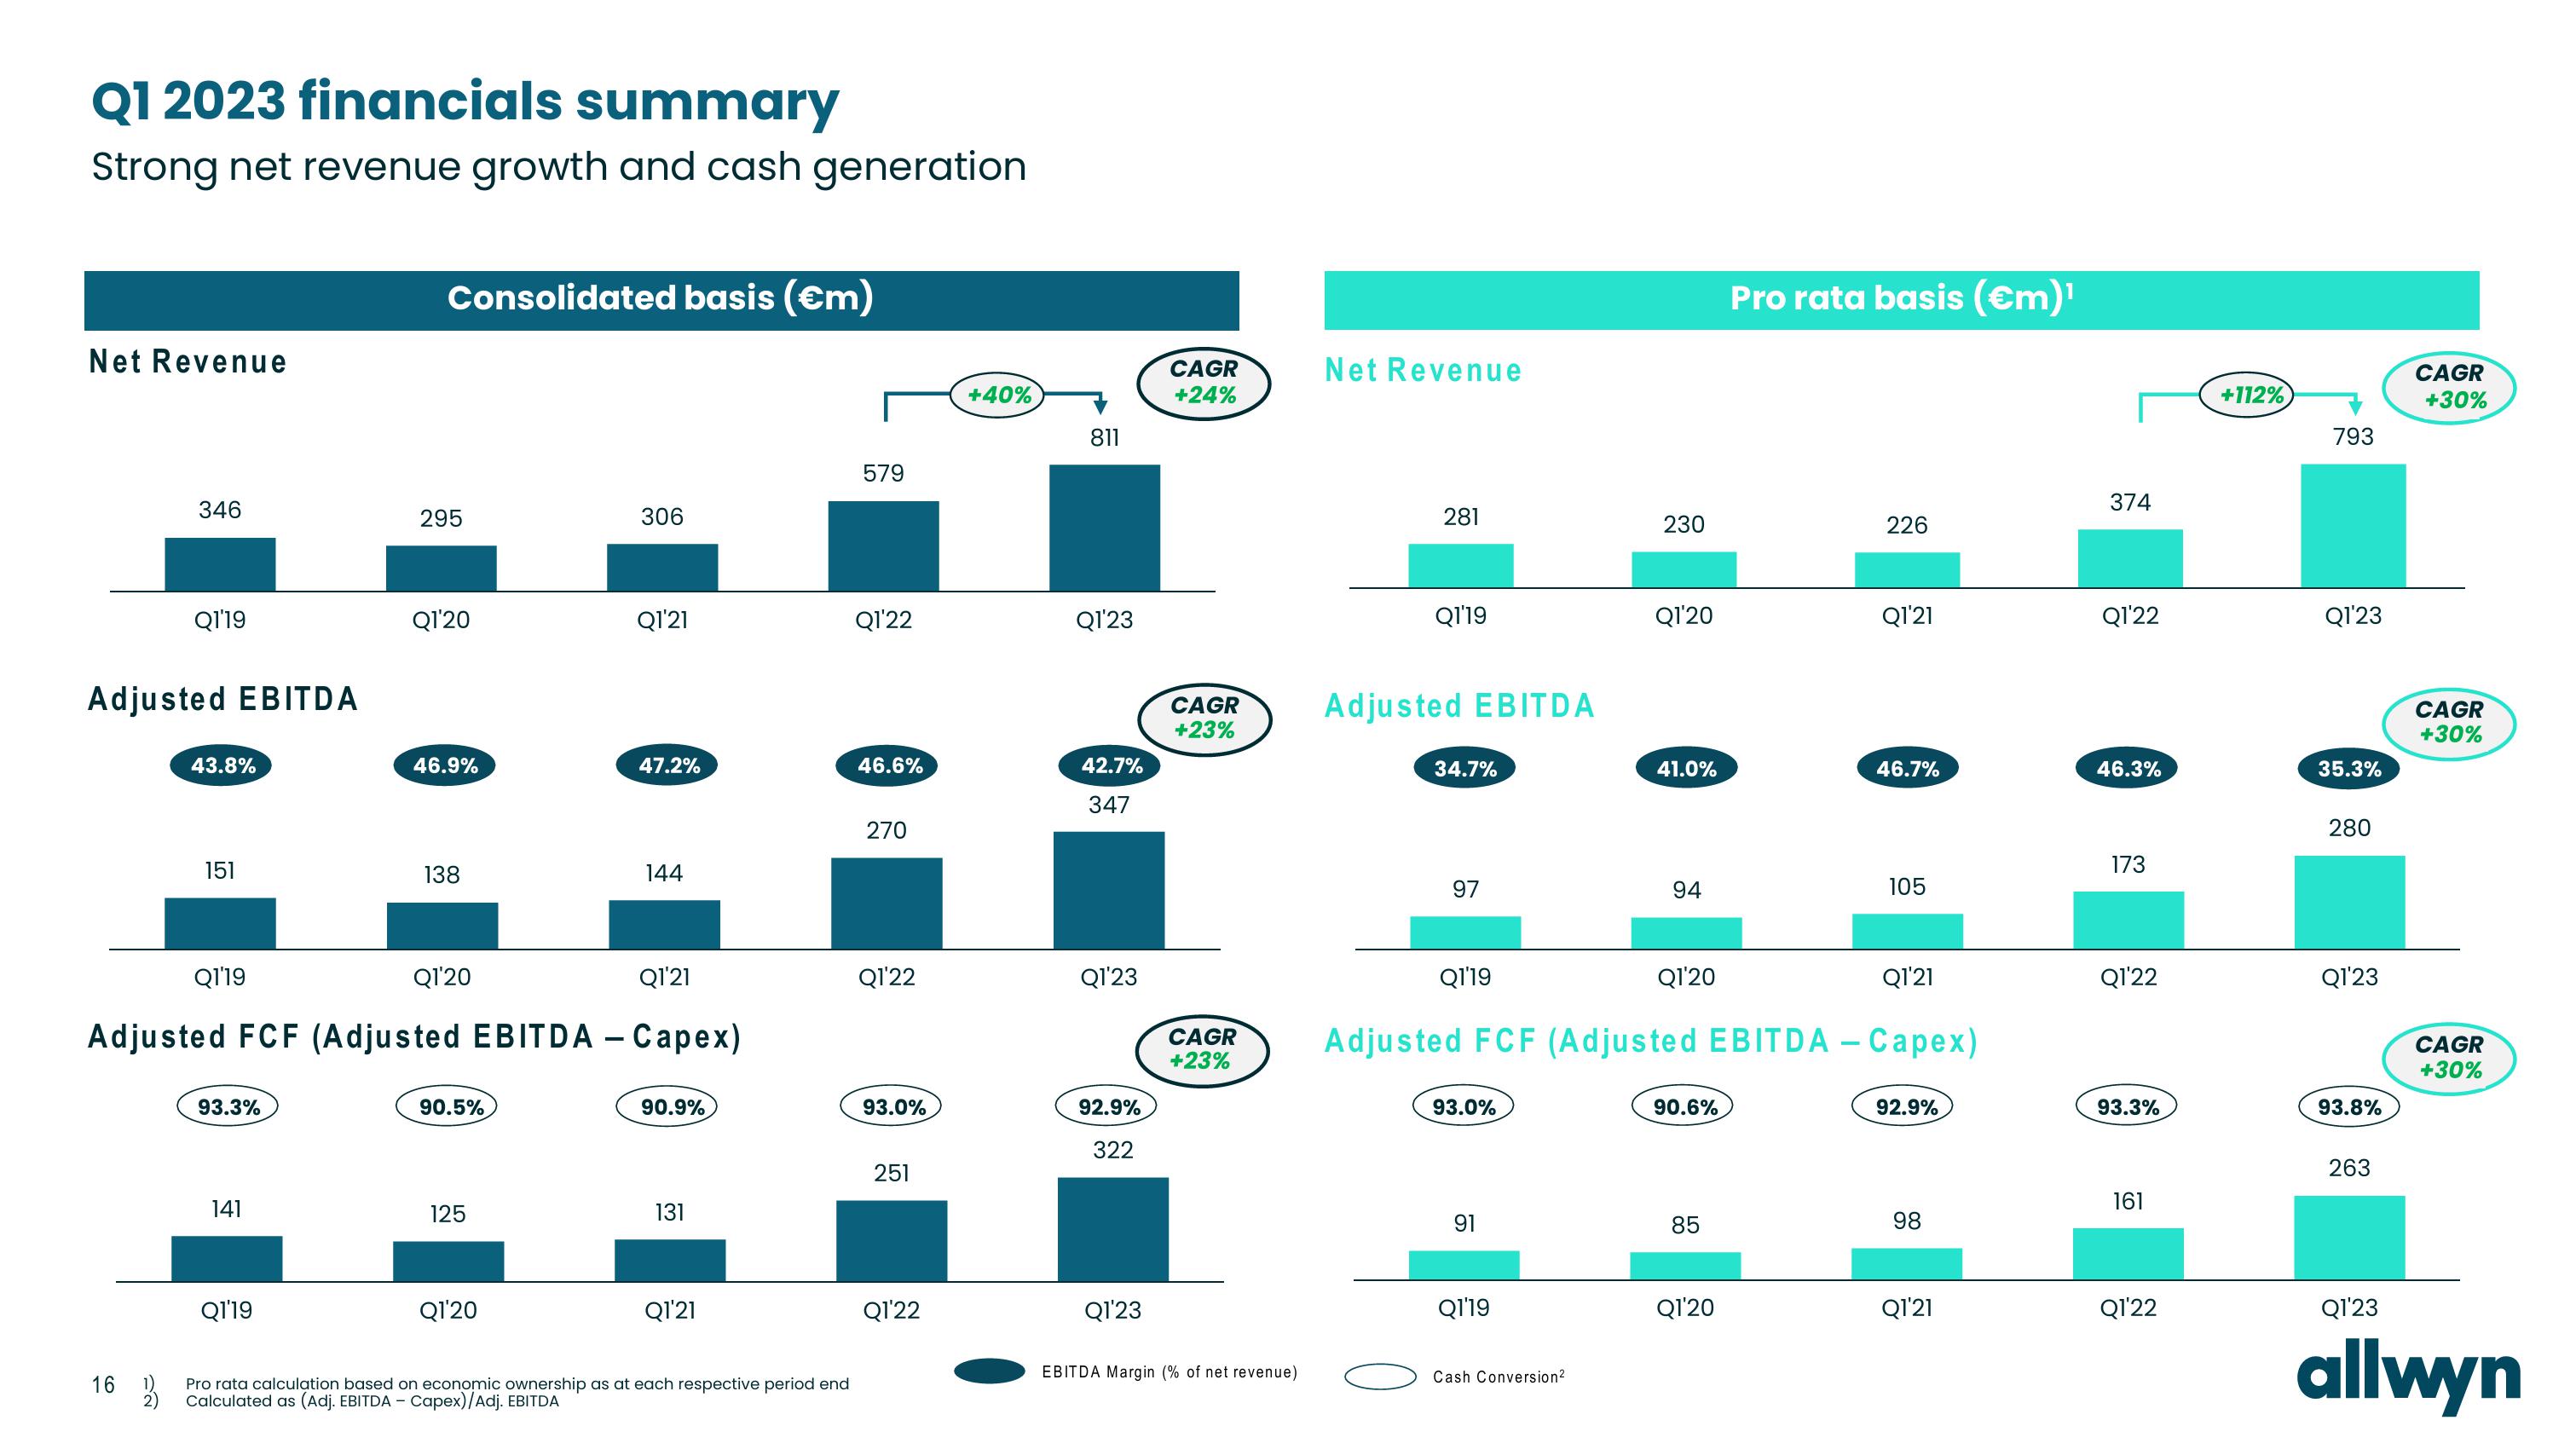
Q1 2023 financials summary
Strong net revenue growth and cash generation
Net Revenue
346
Adjusted EBITDA
16
Q1'19
1)
2)
43.8%
151
Q1'19
93.3%
141
Consolidated basis (€m)
Q1'19
295
Q1'20
46.9%
138
Q1'20
Q1'21
Adjusted FCF (Adjusted EBITDA - Capex)
90.5%
125
306
Q1'20
Q1'21
47.2%
144
90.9%
131
Q1'21
Pro rata calculation based on economic ownership as at each respective period end
Calculated as (Adj. EBITDA - Capex)/Adj. EBITDA
579
Q1'22
46.6%
270
Q1'22
93.0%
251
Q1'22
+40%
811
Q1'23
42.7%
347
Q1'23
92.9%
322
Q1'23
CAGR
+24%
CAGR
+23%
CAGR
+23%
EBITDA Margin (% of net revenue)
Net Revenue
281
Q1'19
Adjusted EBITDA
34.7%
97
Q1'19
93.0%
91
Q1'19
230
Cash Conversion²
Q1'20
41.0%
94
Q1'20
90.6%
Adjusted FCF (Adjusted EBITDA - Capex)
85
Pro rata basis (€m)¹
Q1'20
226
Q1'21
46.7%
105
Q1'21
92.9%
98
Q1'21
374
Q1'22
46.3%
173
Q1'22
93.3%
161
Q1'22
+112%
793
Q1'23
35.3%
280
Q1'23
93.8%
263
CAGR
+30%
CAGR
+30%
CAGR
+30%
Q1'23
allwynView entire presentation