OppFi Results Presentation Deck
20
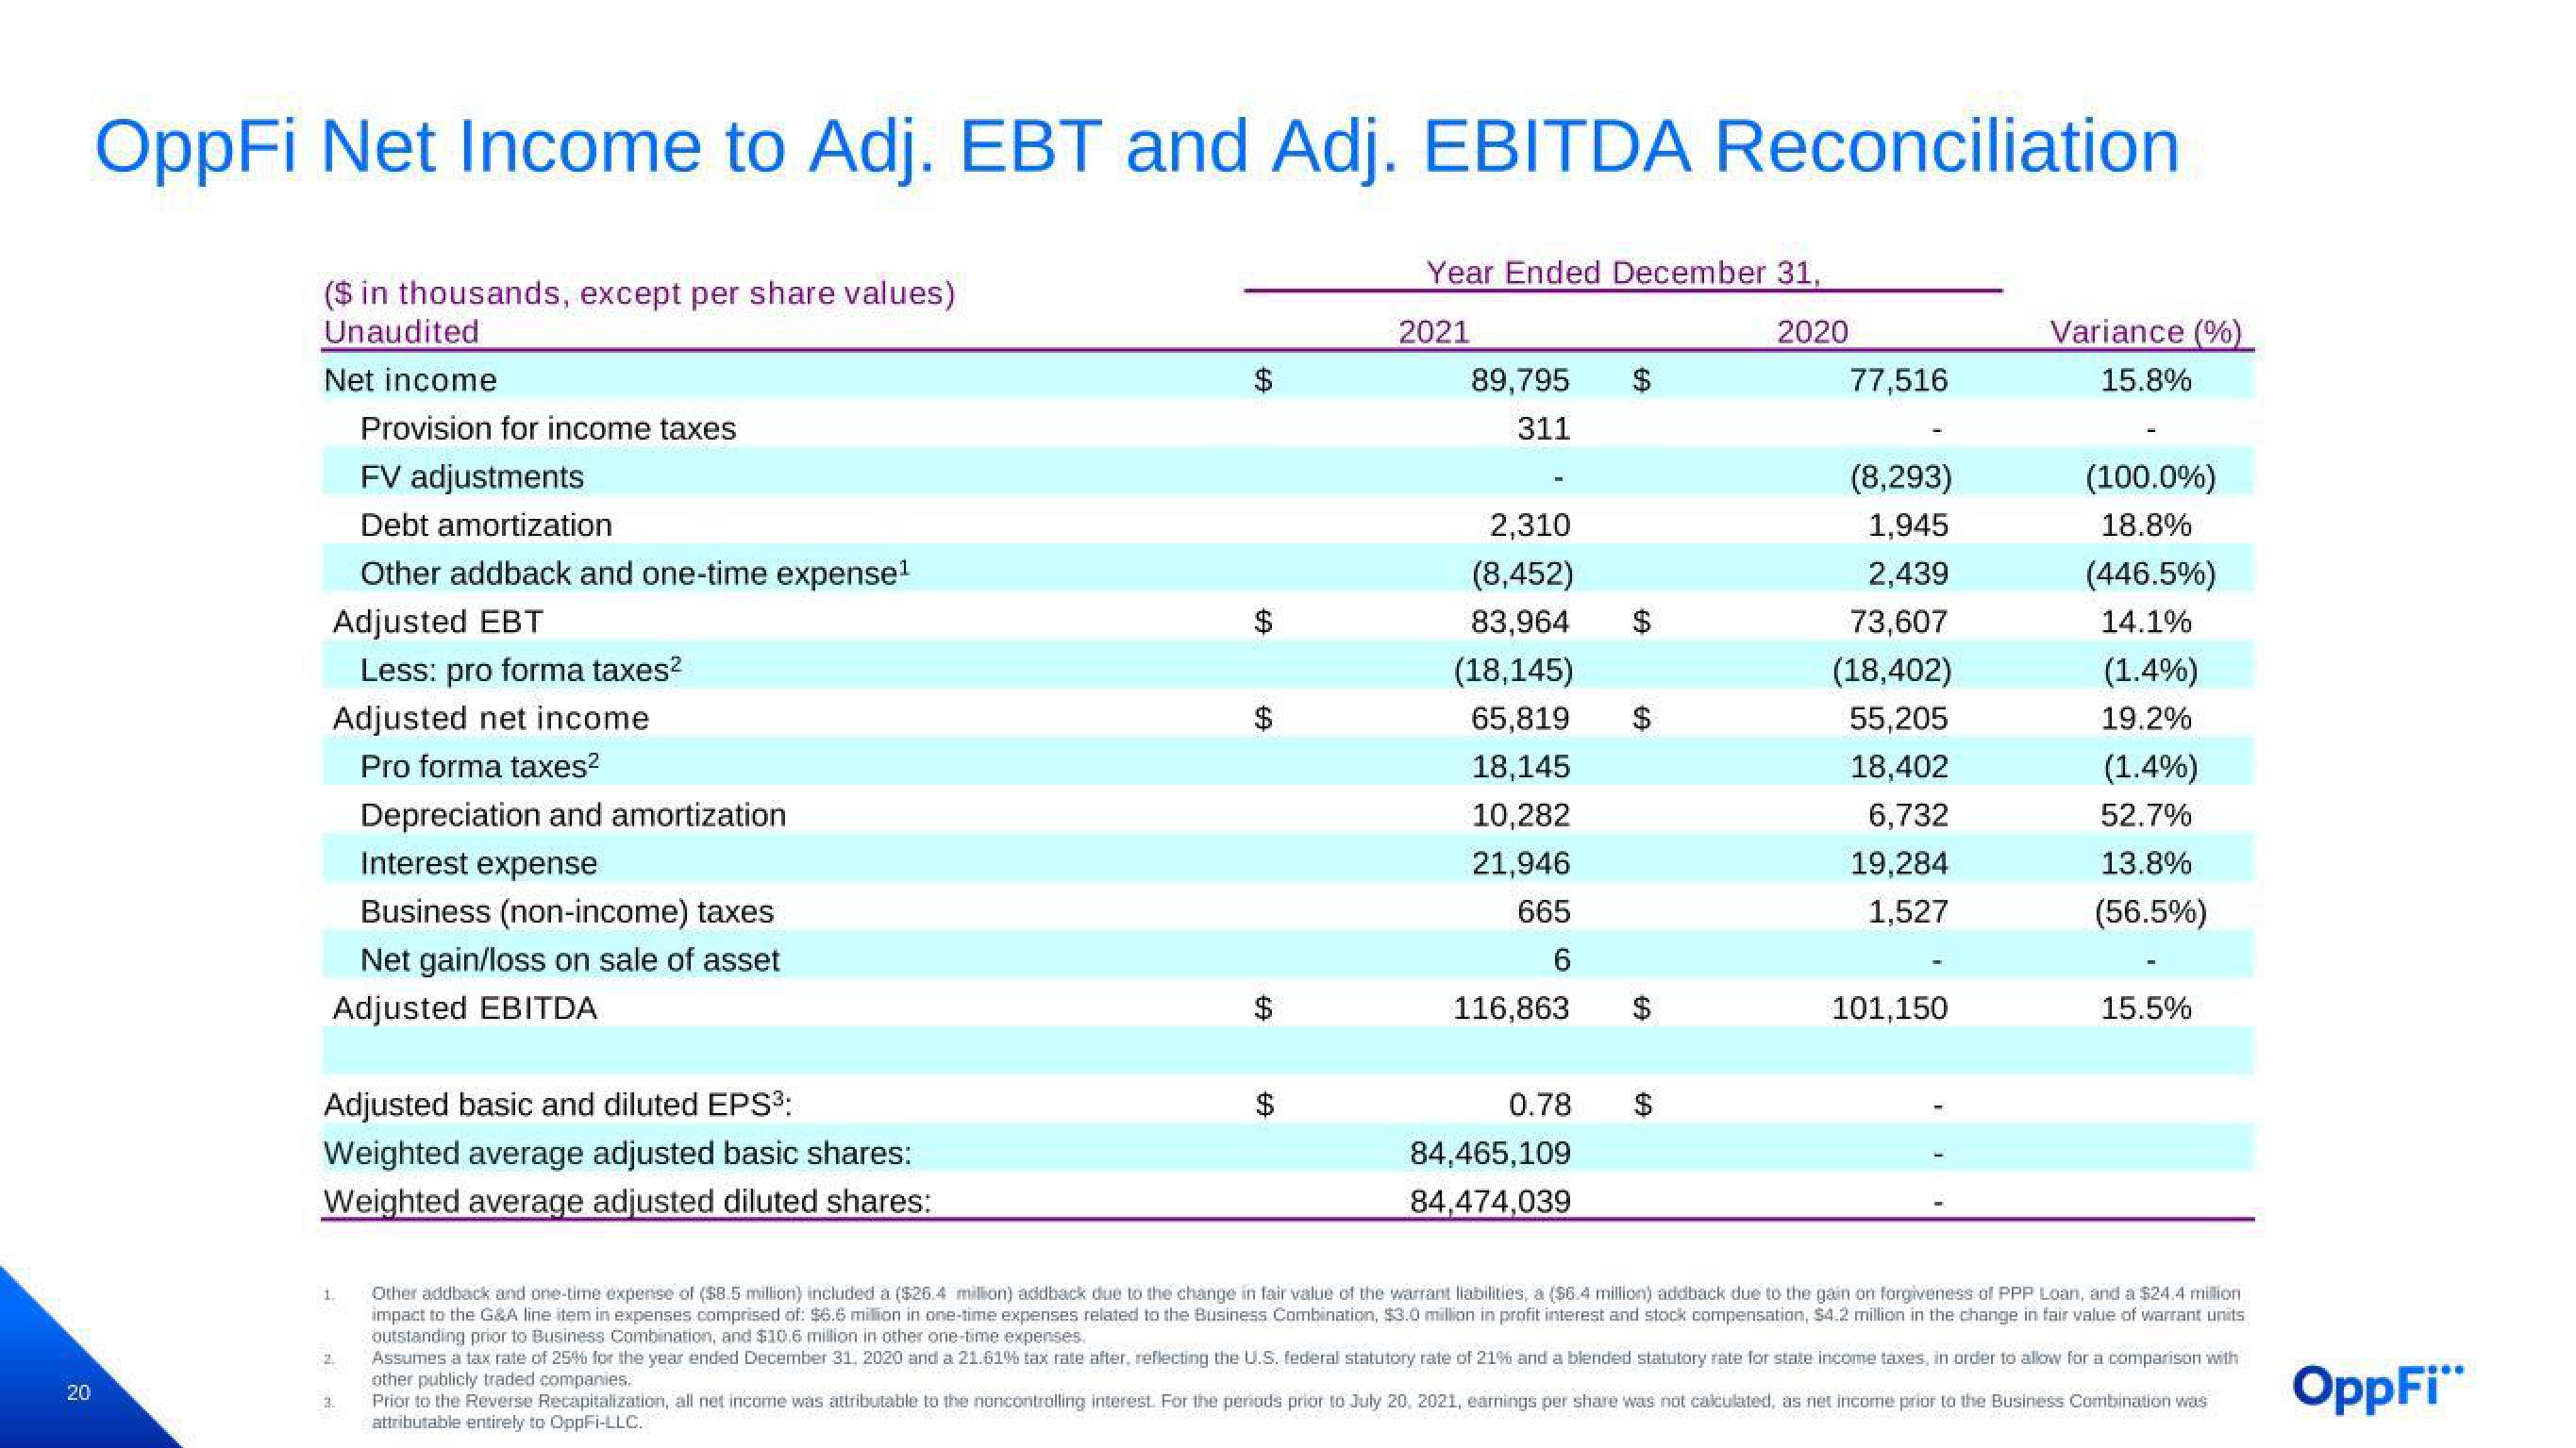
OppFi Net Income to Adj. EBT and Adj. EBITDA Reconciliation
($ in thousands, except per share values)
Unaudited
Net income
Provision for income taxes
FV adjustments
Debt amortization
Other addback and one-time expense¹
Adjusted EBT
Less: pro forma taxes²
Adjusted net income
Pro forma taxes²
Depreciation and amortization
Interest expense
Business (non-income) taxes
Net gain/loss on sale of asset
Adjusted EBITDA
Adjusted basic and diluted EPS³:
Weighted average adjusted basic shares:
Weighted average adjusted diluted shares:
1.
2.
3.
(A
LA
69
69
Year Ended December 31,
2021
2020
89,795
311
2,310
(8,452)
83,964
(18,145)
65,819
18,145
10,282
21,946
665
6
116,863
0.78
84,465,109
84,474,039
77,516
(8,293)
1,945
2,439
73,607
(18,402)
55,205
18,402
6,732
19,284
1,527
101,150
Variance (%)
15.8%
(100.0%)
18.8%
(446.5%)
14.1%
(1.4%)
19.2%
(1.4%)
52.7%
13.8%
(56.5%)
15.5%
Other addback and one-time expense of ($8.5 million) included a ($26.4 million) addback due to the change in fair value of the warrant liabilities, a ($6.4 million) addback due to the gain on forgiveness of PPP Loan, and a $24.4 million
impact to the G&A line item in expenses comprised of: $6.6 million in one-time expenses related to the Business Combination, $3.0 million in profit interest and stock compensation, $4.2 million in the change in fair value of warrant units
outstanding prior to Business Combination, and $10.6 million in other one-time expenses.
Assumes a tax rate of 25% for the year ended December 31, 2020 and a 21.61% tax rate after, reflecting the U.S. federal statutory rate of 21% and a blended statutory rate for state income taxes, in order to allow for a comparison with
other publicly traded companies.
Prior to the Reverse Recapitalization, all net income was attributable to the noncontrolling interest. For the periods prior to July 20, 2021, earnings per share was not calculated, as net income prior to the Business Combination was
attributable entirely to OppFi-LLC.
OppFi"View entire presentation