THOR Industries Results Presentation Deck
STRONG FINANCIAL POSITION
THO
(BILD
NYSE
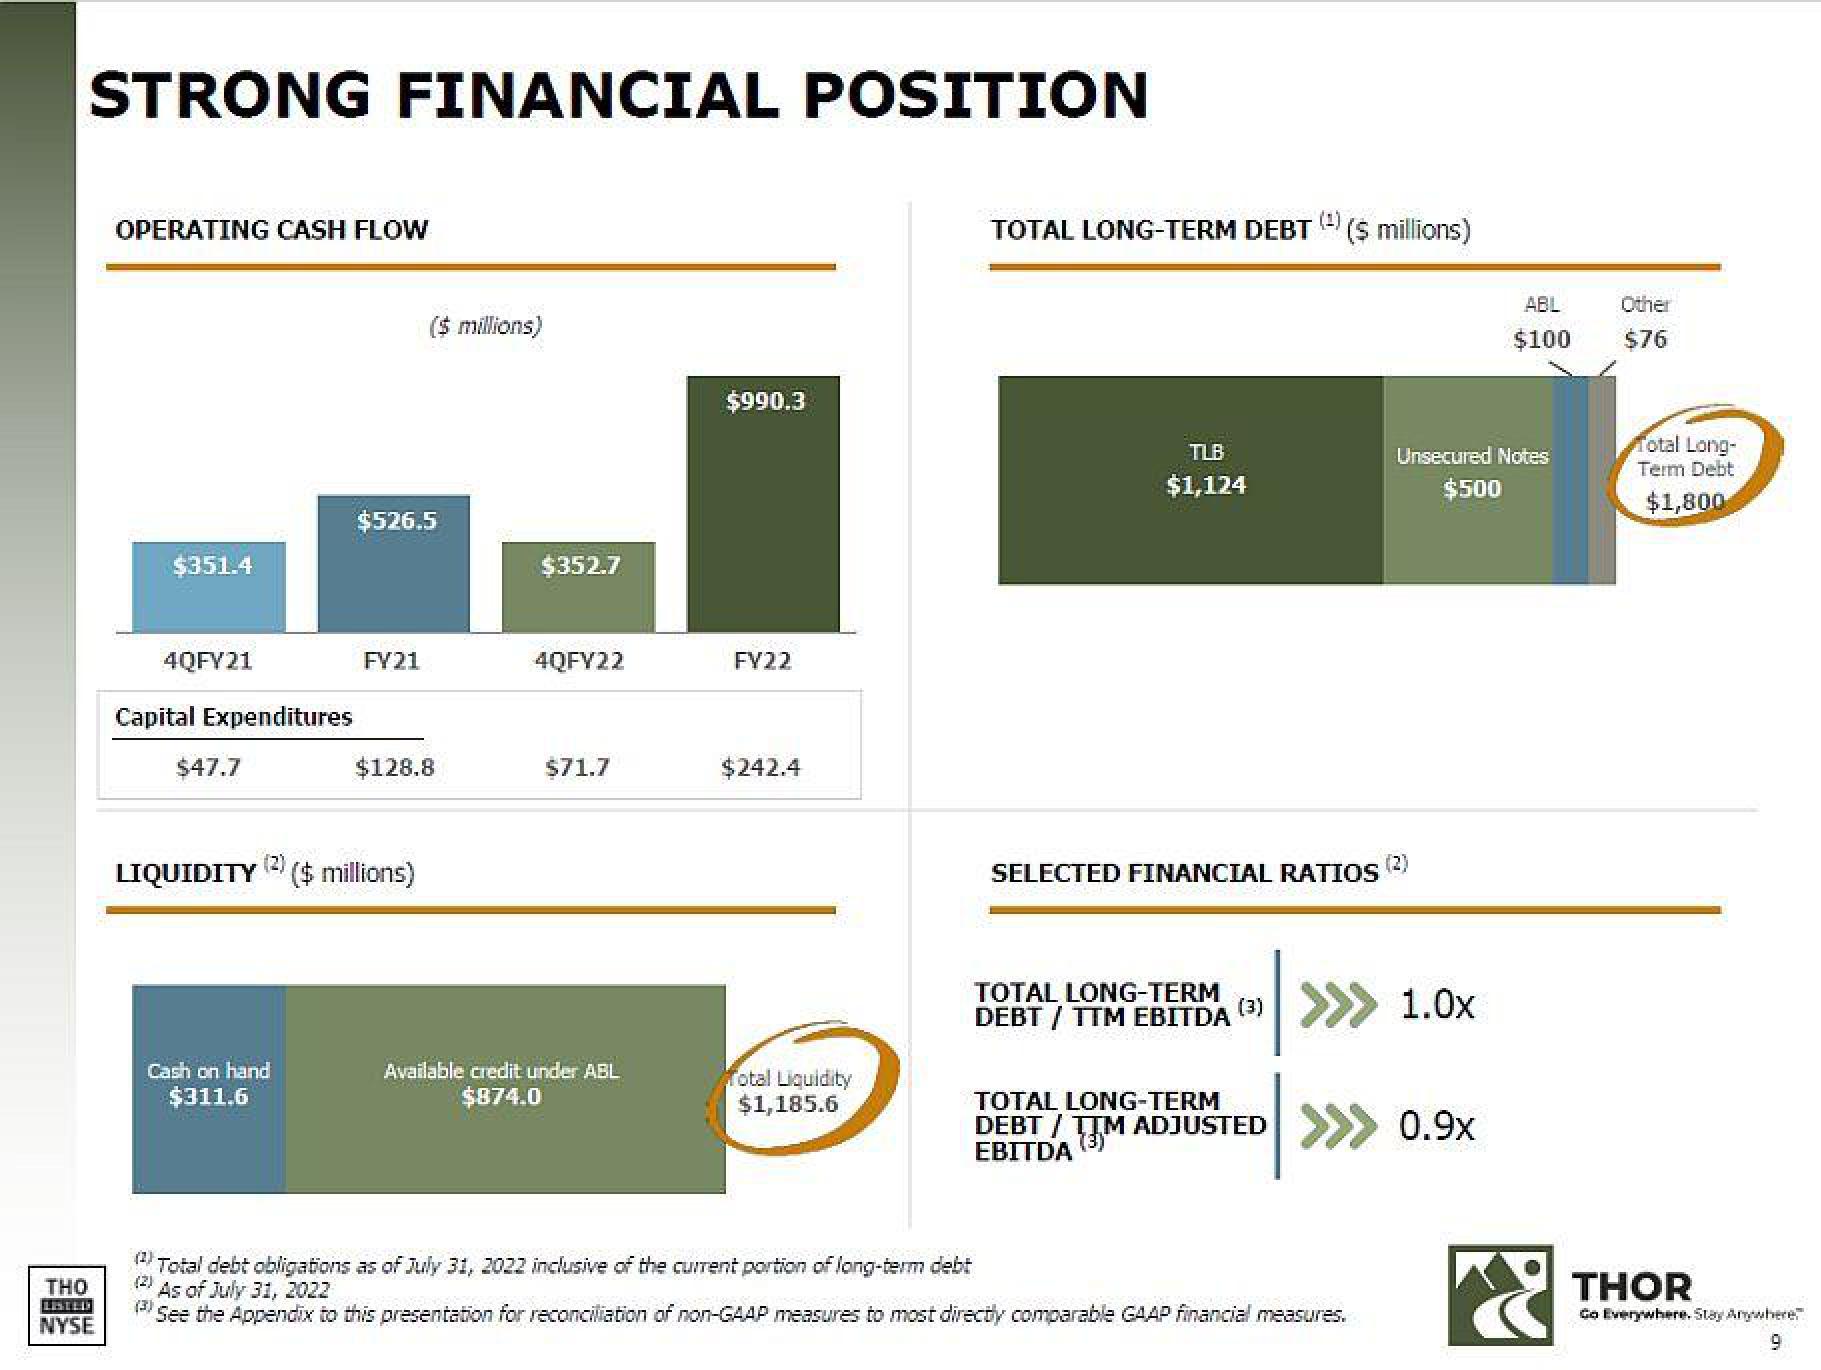
OPERATING CASH FLOW
$351.4
4QFY21
Capital Expenditures
$47.7
Cash on hand
$311.6
$526.5
FY21
($ millions)
LIQUIDITY($ millions)
$128.8
$352.7
4QFY22
$71.7
Available credit under ABL
$874.0
$990.3
FY22
$242.4
Total Liquidity
$1,185.6
TOTAL LONG-TERM DEBT($ millions)
TLB
$1,124
SELECTED FINANCIAL RATIOS
TOTAL LONG-TERM
DEBT / TTM EBITDA
TOTAL LONG-TERM
DEBT / TTM ADJUSTED
EBITDA (3)
(3) >>> 1.0x
Total debt obligations as of July 31, 2022 inclusive of the current portion of long-term debt
(2)
As of July 31, 2022
(3)
See the Appendix to this presentation for reconciliation of non-GAAP measures to most directly comparable GAAP financial measures.
Unsecured Notes
$500
(2)
ABL
$100
0.9x
Other
$76
Total Long-
Term Debt
$1,800
THOR
Go Everywhere. Stay Anywhere
9View entire presentation