Getty SPAC Presentation Deck
Summary Financial Overview
% Growth:
($ in millions)
% Subscription:
36%
$749
14
276
459
FY17A
3%
39%
296
503
5.3% CAGR (FY 2017 - FY 2022E)¹
$815
16
FY18A
Revenue
9%
44%
$823
13
294
516
FY19A
46%
1%
$810
13
266
532
FY20A
(1%)
45%
$910
15
296
Creative Editorial Other
599
FY21E
12%
46%
$980
$955
FY22E
6%¹
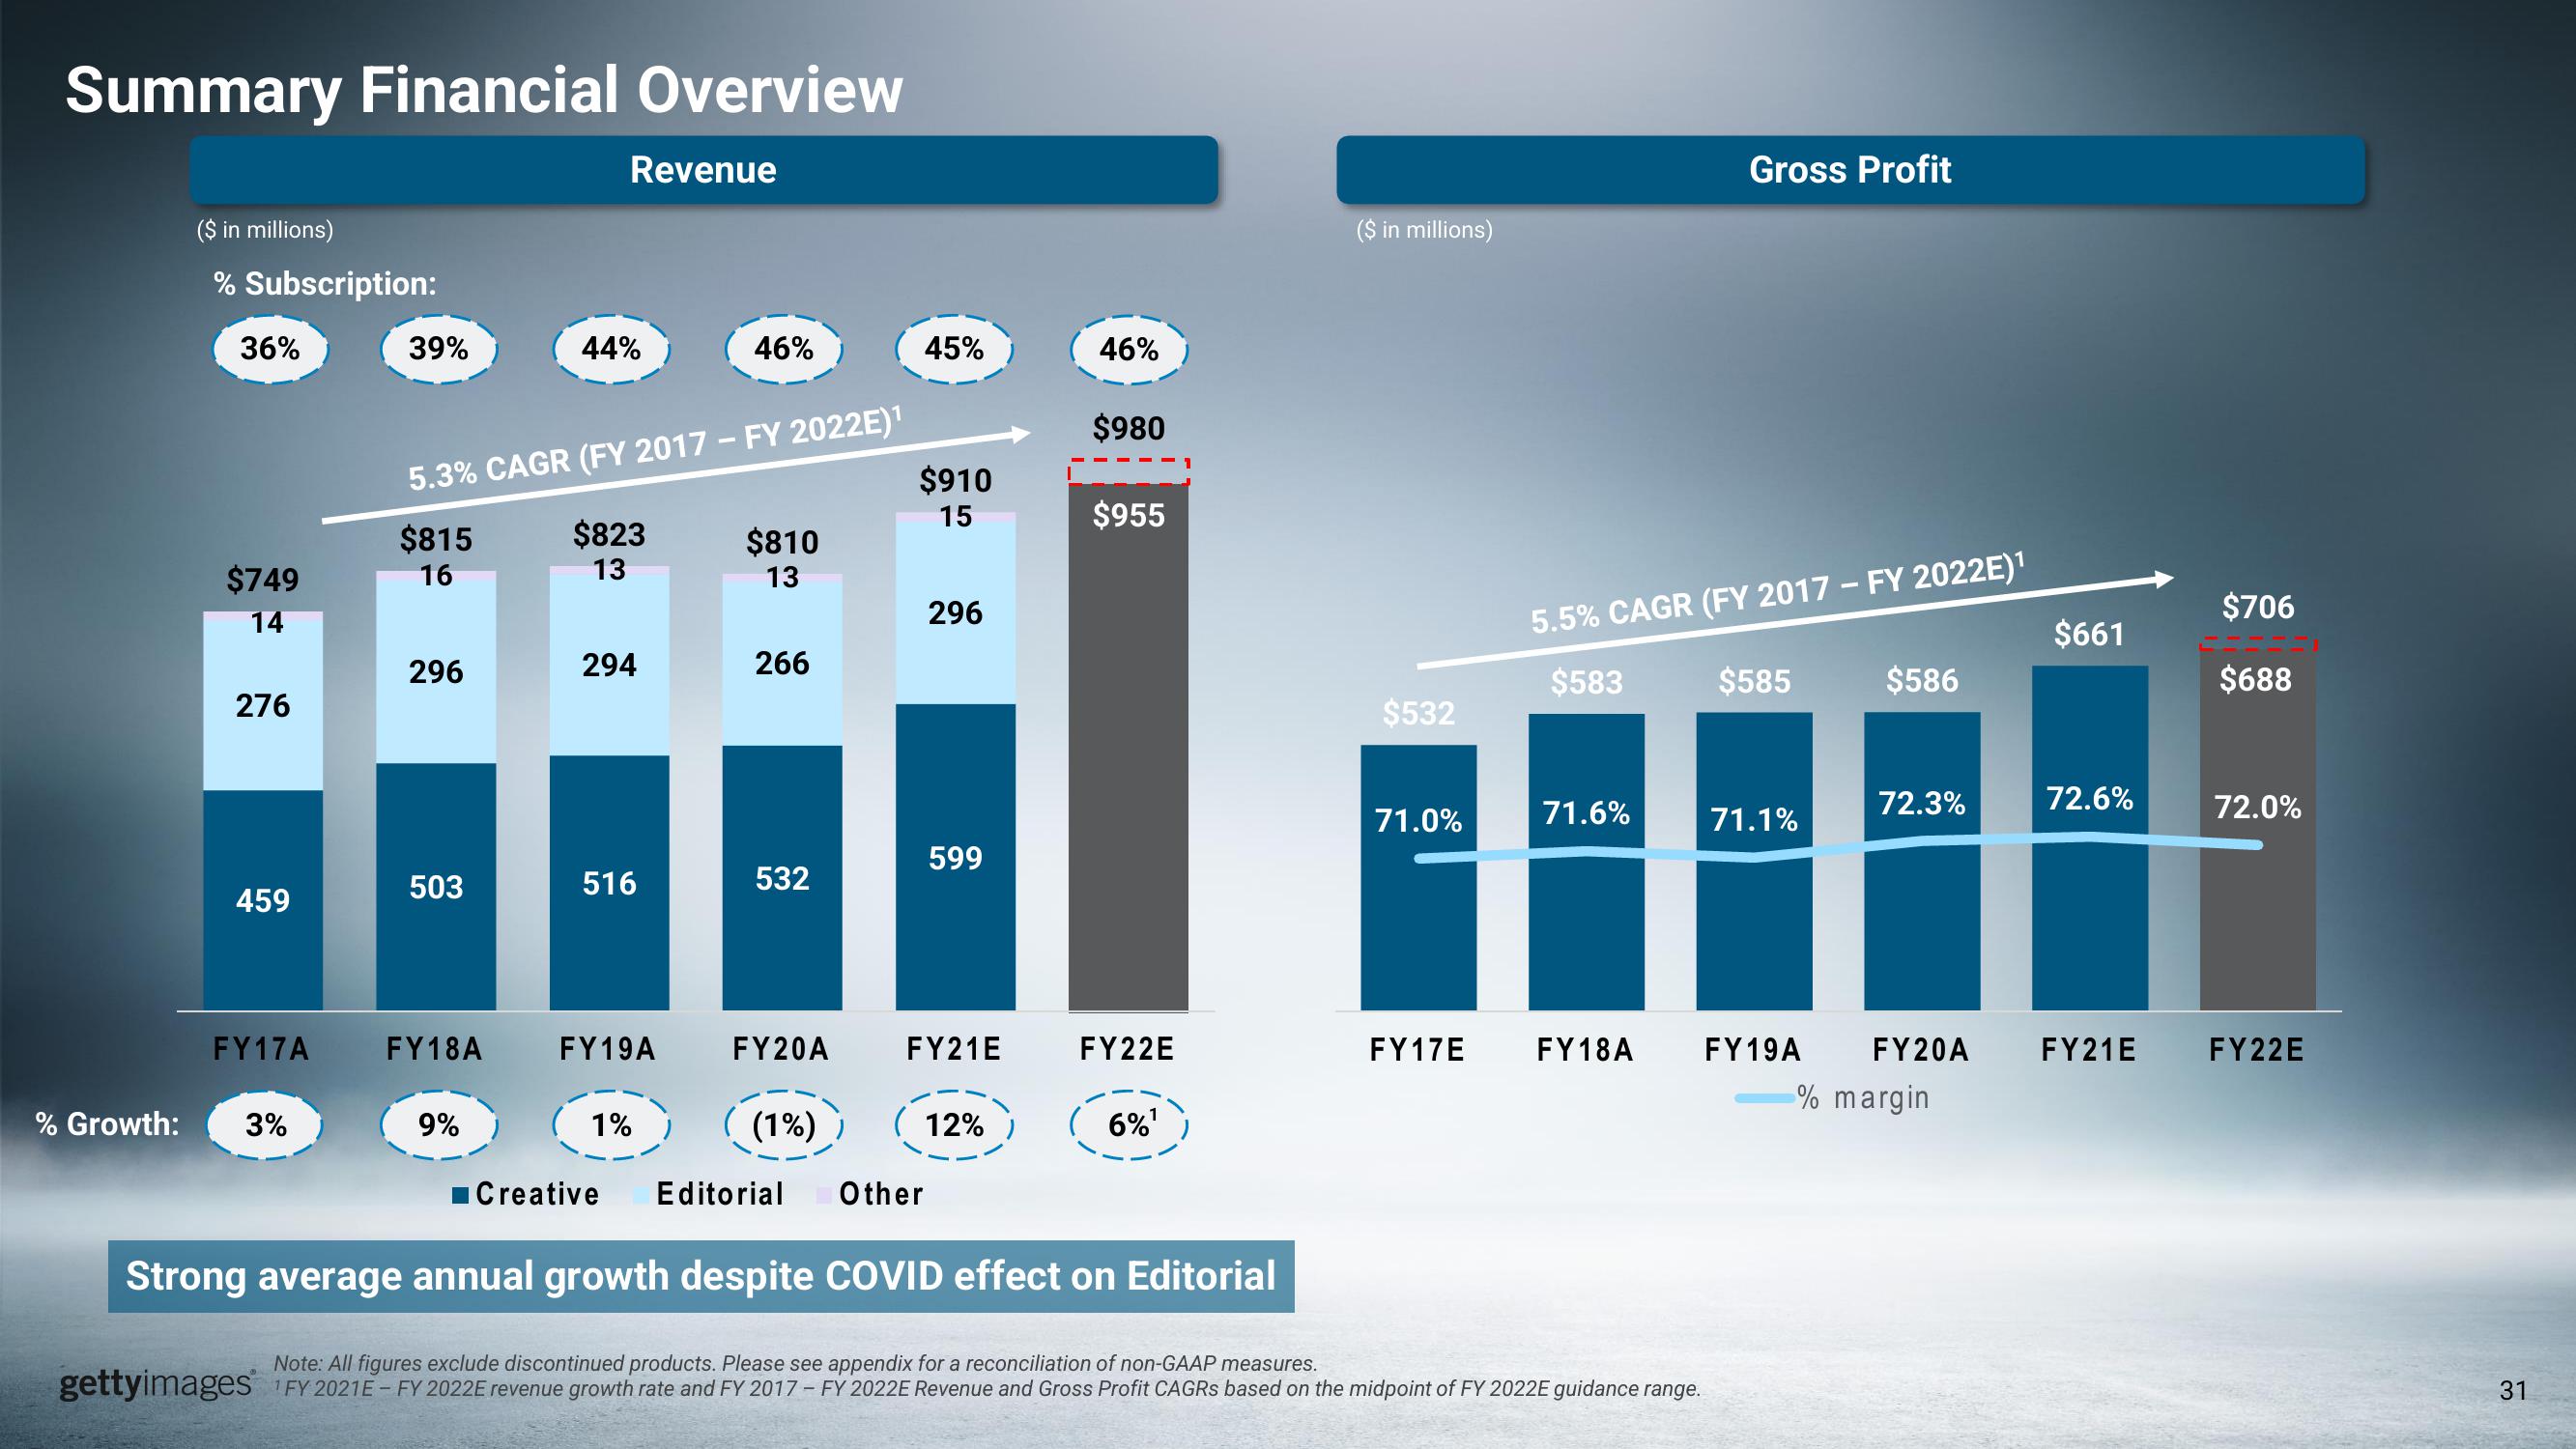
Strong average annual growth despite COVID effect on Editorial
($ in millions)
$532
71.0%
FY17E
5.5% CAGR (FY 2017 - FY 2022E)¹
$583
71.6%
FY18A
Gross Profit
Note: All figures exclude discontinued products. Please see appendix for a reconciliation of non-GAAP measures.
gettyimages FY 2021E - FY 2022E revenue growth rate and FY 2017 - FY 2022E Revenue and Gross Profit CAGRS based on the midpoint of FY 2022E guidance range.
$585
71.1%
FY19A
$586
72.3%
FY20A
% margin
$661
72.6%
FY21E
$706
$688
72.0%
FY22E
31View entire presentation