Xos SPAC Presentation Deck
Summary Financial Forecast
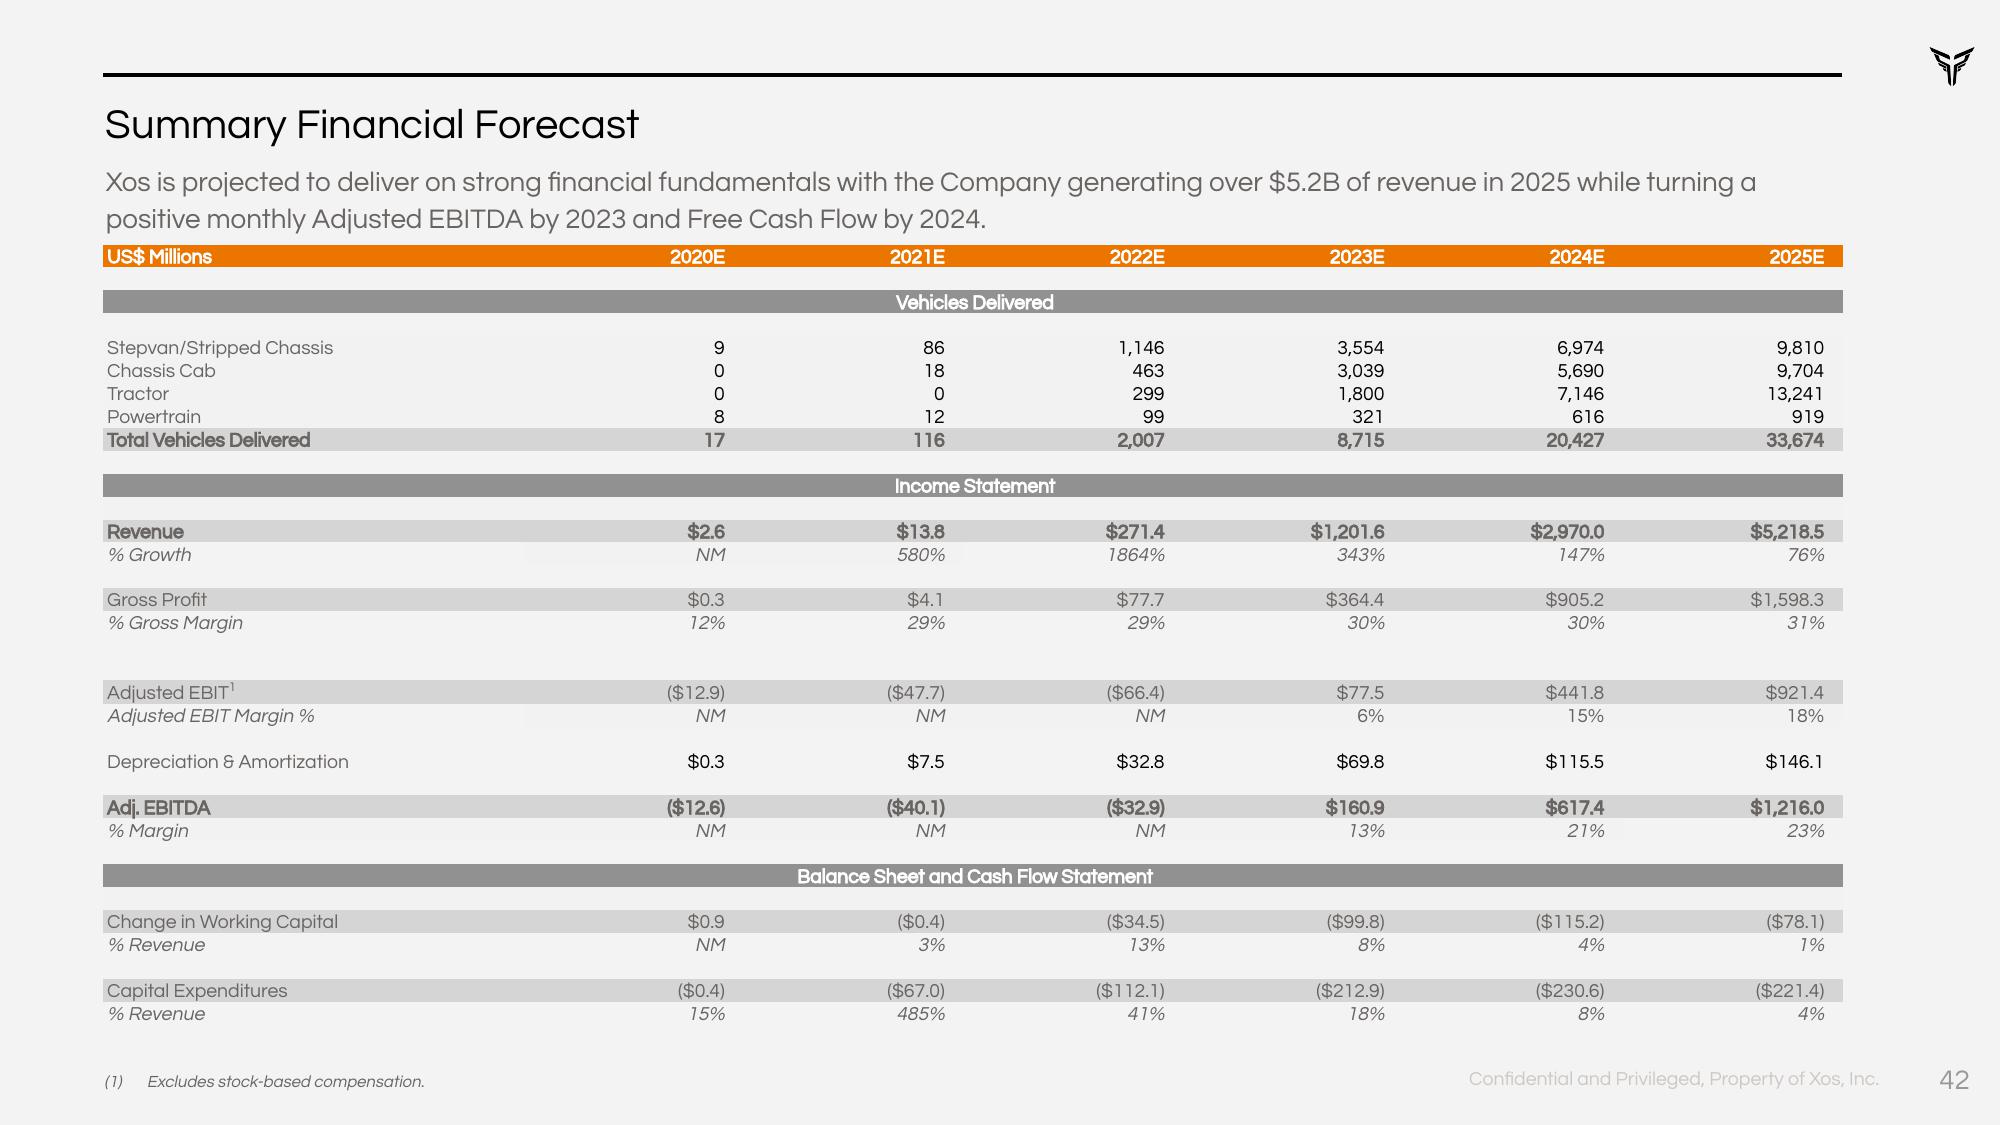
Xos is projected to deliver on strong financial fundamentals with the Company generating over $5.2B of revenue in 2025 while turning a
positive monthly Adjusted EBITDA by 2023 and Free Cash Flow by 2024.
US$ Millions
2020E
2021E
Stepvan/Stripped Chassis
Chassis Cab
Tractor
Powertrain
Total Vehicles Delivered
Revenue
% Growth
Gross Profit
% Gross Margin
Adjusted EBIT
Adjusted EBIT Margin %
Depreciation & Amortization
Adj. EBITDA
% Margin
Change in Working Capital
% Revenue
Capital Expenditures
% Revenue
(1) Excludes stock-based compensation.
H8006
17
$2.6
NM
$0.3
12%
($12.9)
NM
$0.3
($12.6)
NM
$0.9
NM
($0.4)
15%
Vehicles Delivered
86
18
0
12
116
Income Statement
$13.8
580%
$4.1
29%
($47.7)
NM
$7.5
($40.1)
NM
($0.4)
3%
2022E
($67.0)
485%
1,146
463
299
99
2,007
$271.4
1864%
$77.7
29%
($66.4)
NM
$32.8
Balance Sheet and Cash Flow Statement
($32.9)
NM
($34.5)
13%
($112.1)
41%
2023E
3,554
3,039
1,800
321
8,715
$1,201.6
343%
$364.4
30%
$77.5
6%
$69.8
$160.9
13%
($99.8)
8%
($212.9)
18%
2024E
6,974
5,690
7,146
616
20,427
$2,970.0
147%
$905.2
30%
$441.8
15%
$115.5
$617.4
21%
($115.2)
4%
($230.6)
8%
2025E
9,810
9,704
13,241
919
33,674
$5,218.5
76%
$1,598.3
31%
$921.4
18%
$146.1
$1,216.0
23%
($78.1)
1%
($221.4)
4%
Confidential and Privileged, Property of Xos, Inc.
F
42View entire presentation