Kinnevik Results Presentation Deck
Intro
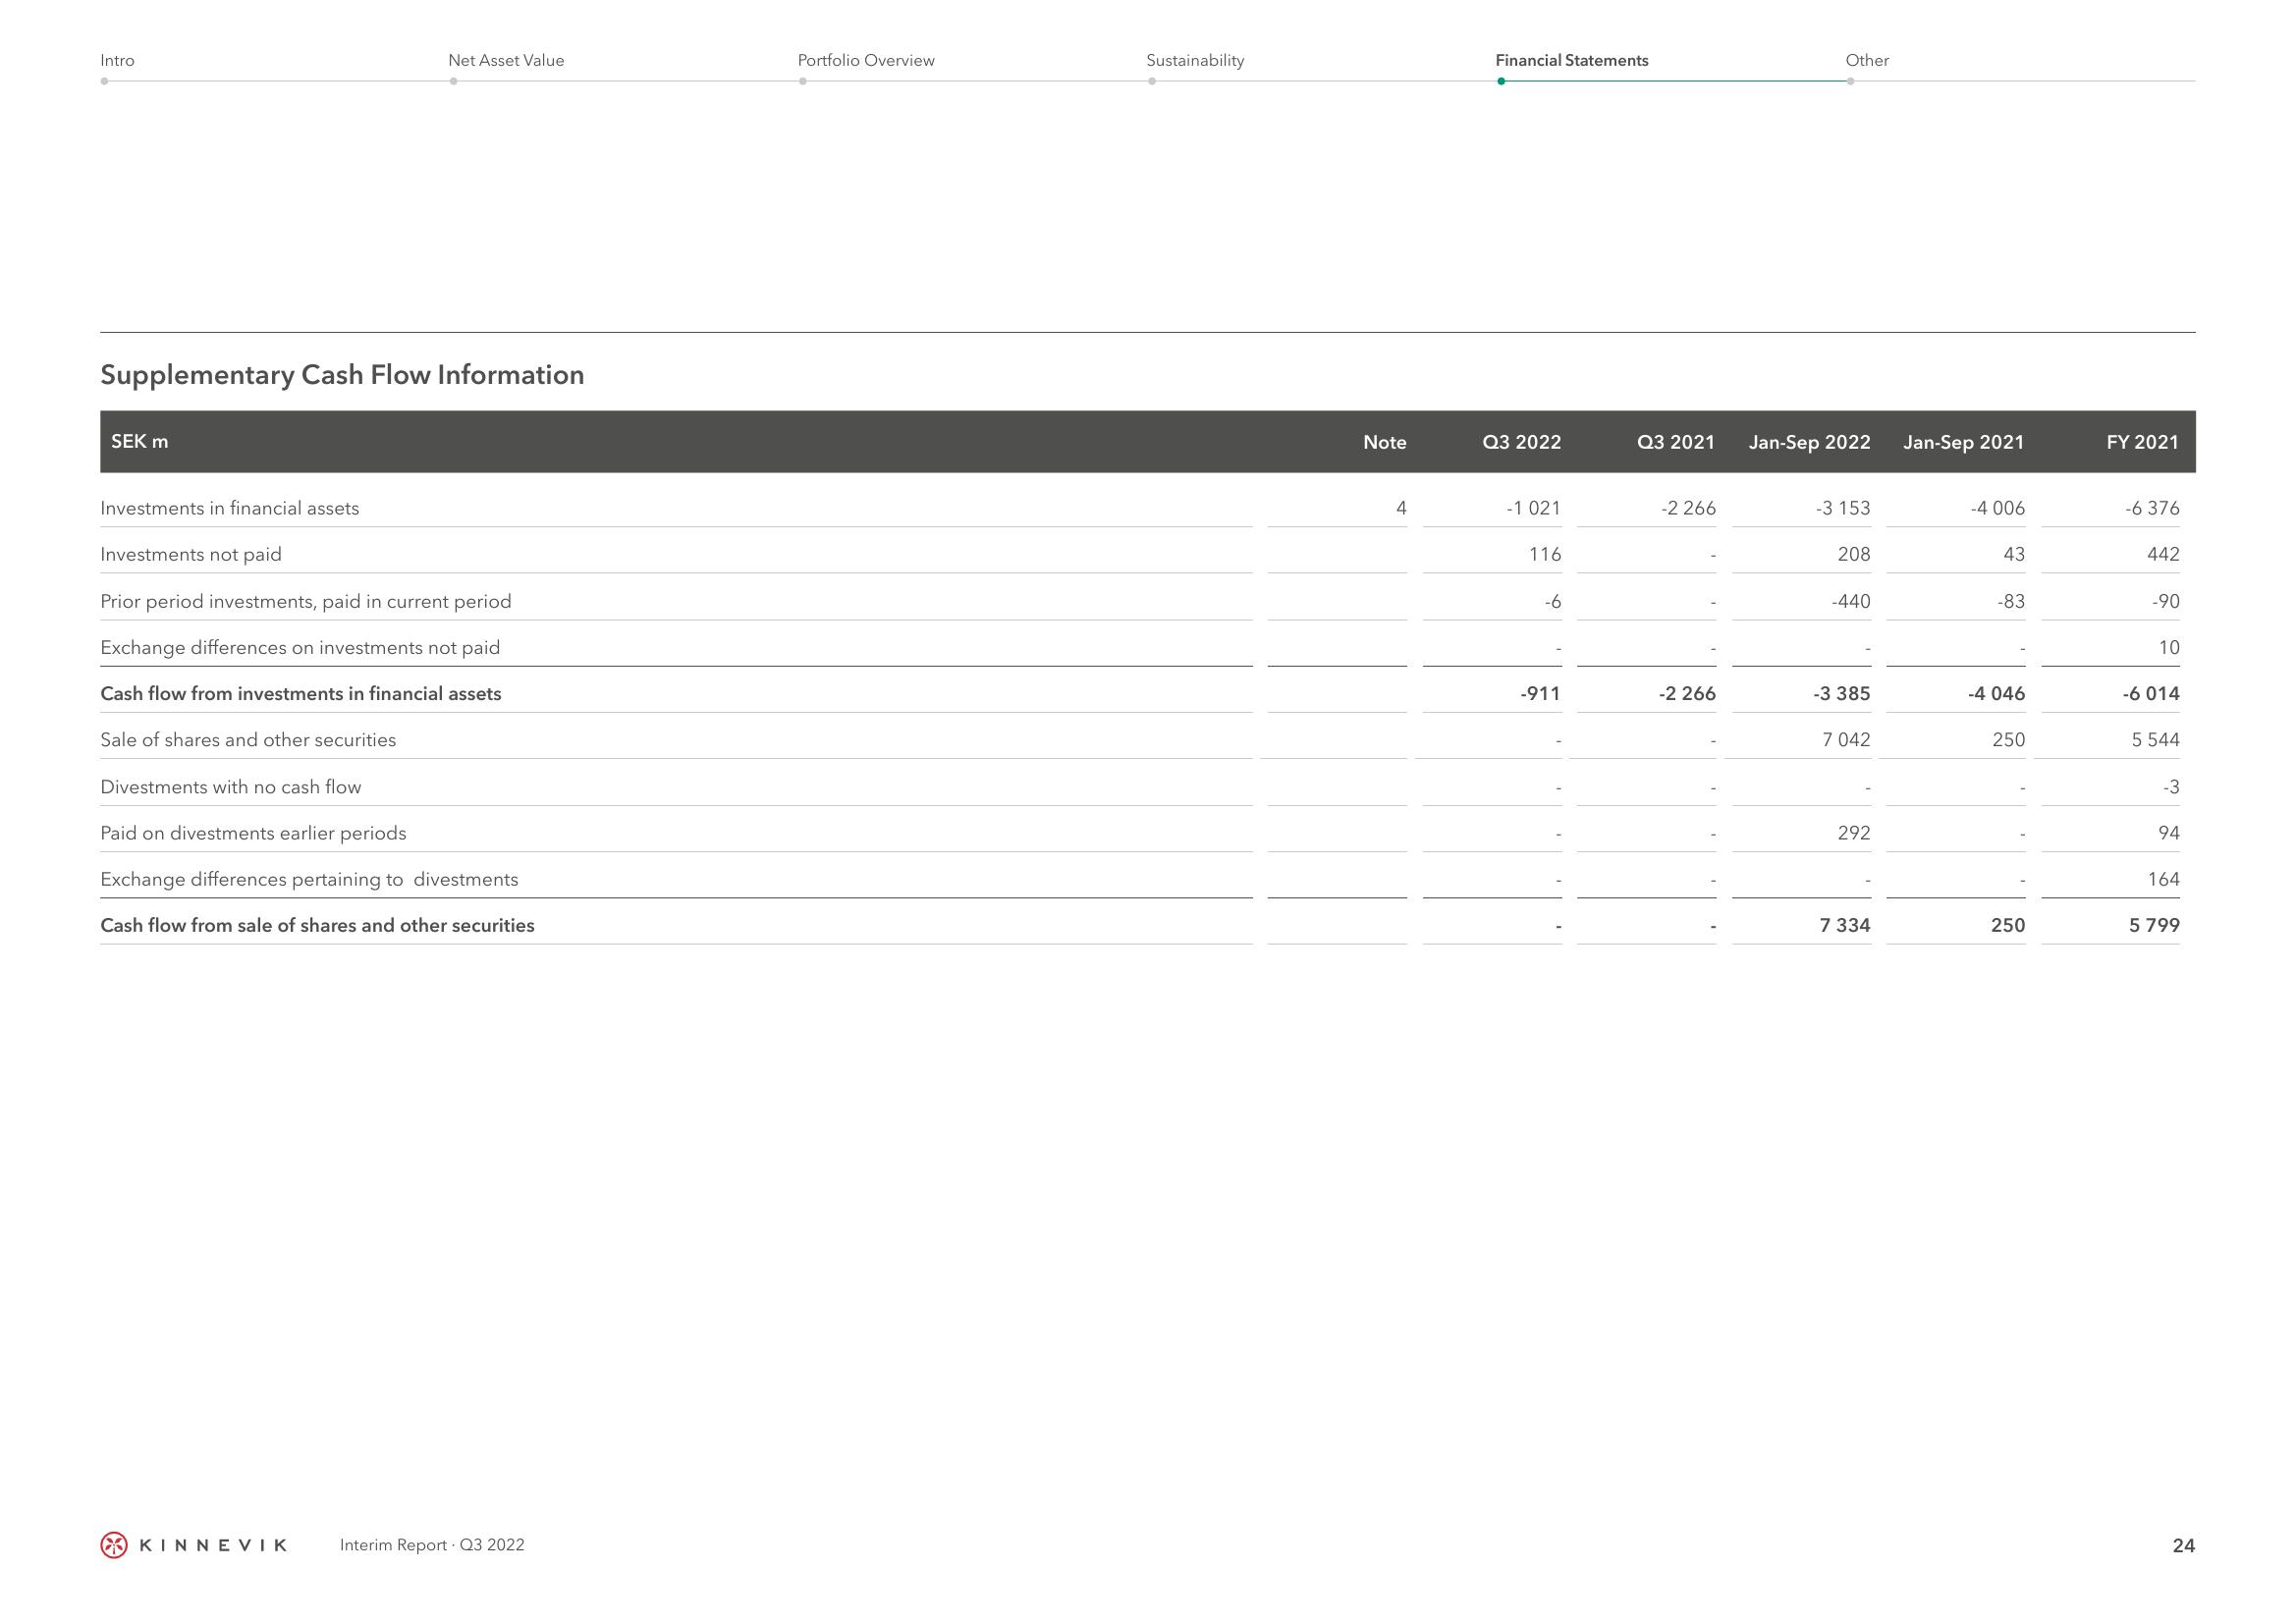
Supplementary Cash Flow Information
SEK m
Net Asset Value
Investments in financial assets
Investments not paid
Prior period investments, paid in current period
Exchange differences on investments not paid
Cash flow from investments in financial assets
Sale of shares and other securities
Divestments with no cash flow
Paid on divestments earlier periods
Exchange differences pertaining to divestments
Cash flow from sale of shares and other securities
KINNEVIK
Interim Report Q3 2022
Portfolio Overview
Sustainability
Note
Financial Statements
Q3 2022
-1 021
116
-6
-911
Q3 2021
-2 266
-2 266
Other
Jan-Sep 2022
-3 153
208
-440
-3 385
7 042
292
7 334
Jan-Sep 2021
-4 006
43
-83
-4 046
250
250
FY 2021
-6 376
442
-90
10
-6 014
5 544
-3
94
164
5 799
24View entire presentation