Verint SPAC Presentation Deck
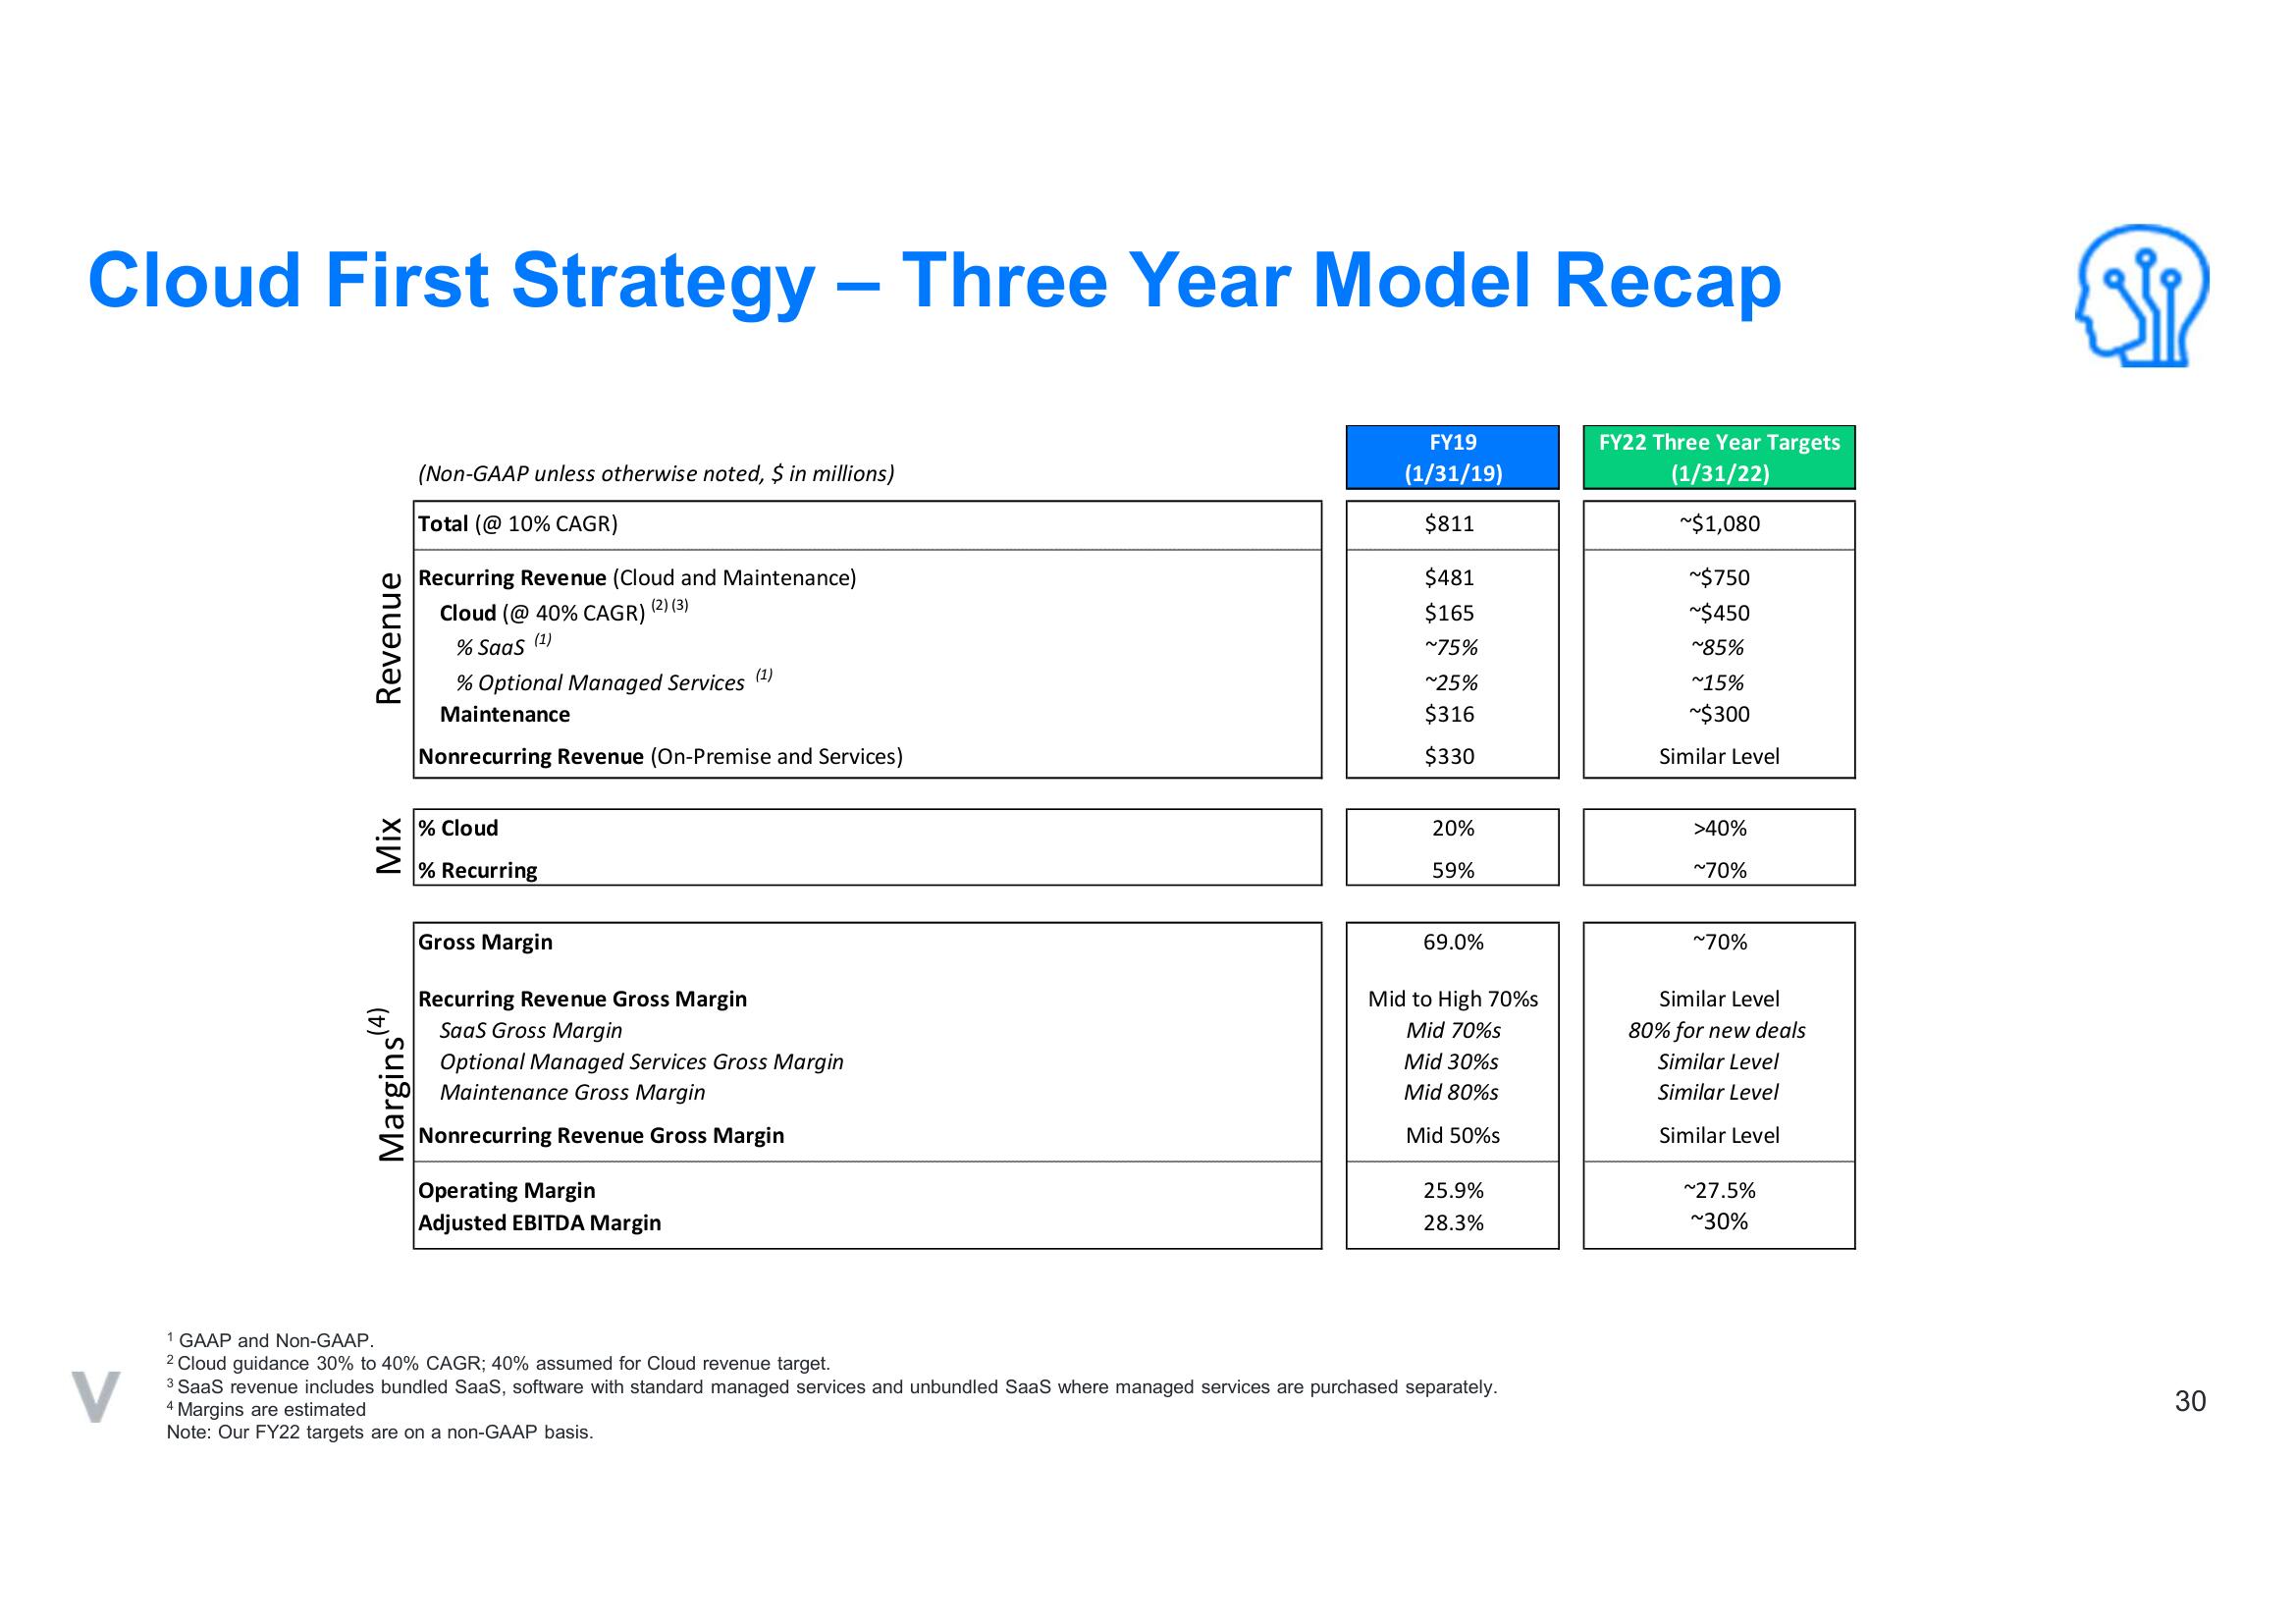
Cloud First Strategy - Three Year Model Recap
Revenue
Mix
Margins (4)
(Non-GAAP unless otherwise noted, $ in millions)
Total (@ 10% CAGR)
Recurring Revenue (Cloud and Maintenance)
(2)(3)
Cloud (@ 40% CAGR)
(1)
% SaaS
% Optional Managed Services (¹)
Maintenance
Nonrecurring Revenue (On-Premise and Services)
% Cloud
% Recurring
Gross Margin
Recurring Revenue Gross Margin
SaaS Gross Margin
Optional Managed Services Gross Margin
Maintenance Gross Margin
Nonrecurring Revenue Gross Margin
Operating Margin
Adjusted EBITDA Margin
FY19
(1/31/19)
$811
$481
$165
~75%
~25%
$316
$330
20%
59%
69.0%
Mid to High 70%s
Mid 70%s
Mid 30%s
Mid 80%s
Mid 50%s
25.9%
28.3%
1 GAAP and Non-GAAP.
2 Cloud guidance 30% to 40% CAGR; 40% assumed for Cloud revenue target.
3 SaaS revenue includes bundled SaaS, software with standard managed services and unbundled SaaS where managed services are purchased separately.
4 Margins are estimated
Note: Our FY22 targets are on a non-GAAP basis.
FY22 Three Year Targets
(1/31/22)
~$1,080
~$750
~$450
~85%
~15%
~$300
Similar Level
>40%
~70%
~70%
Similar Level
80% for new deals
Similar Level
Similar Level
Similar Level
~27.5%
~30%
30View entire presentation