Paysafe Results Presentation Deck
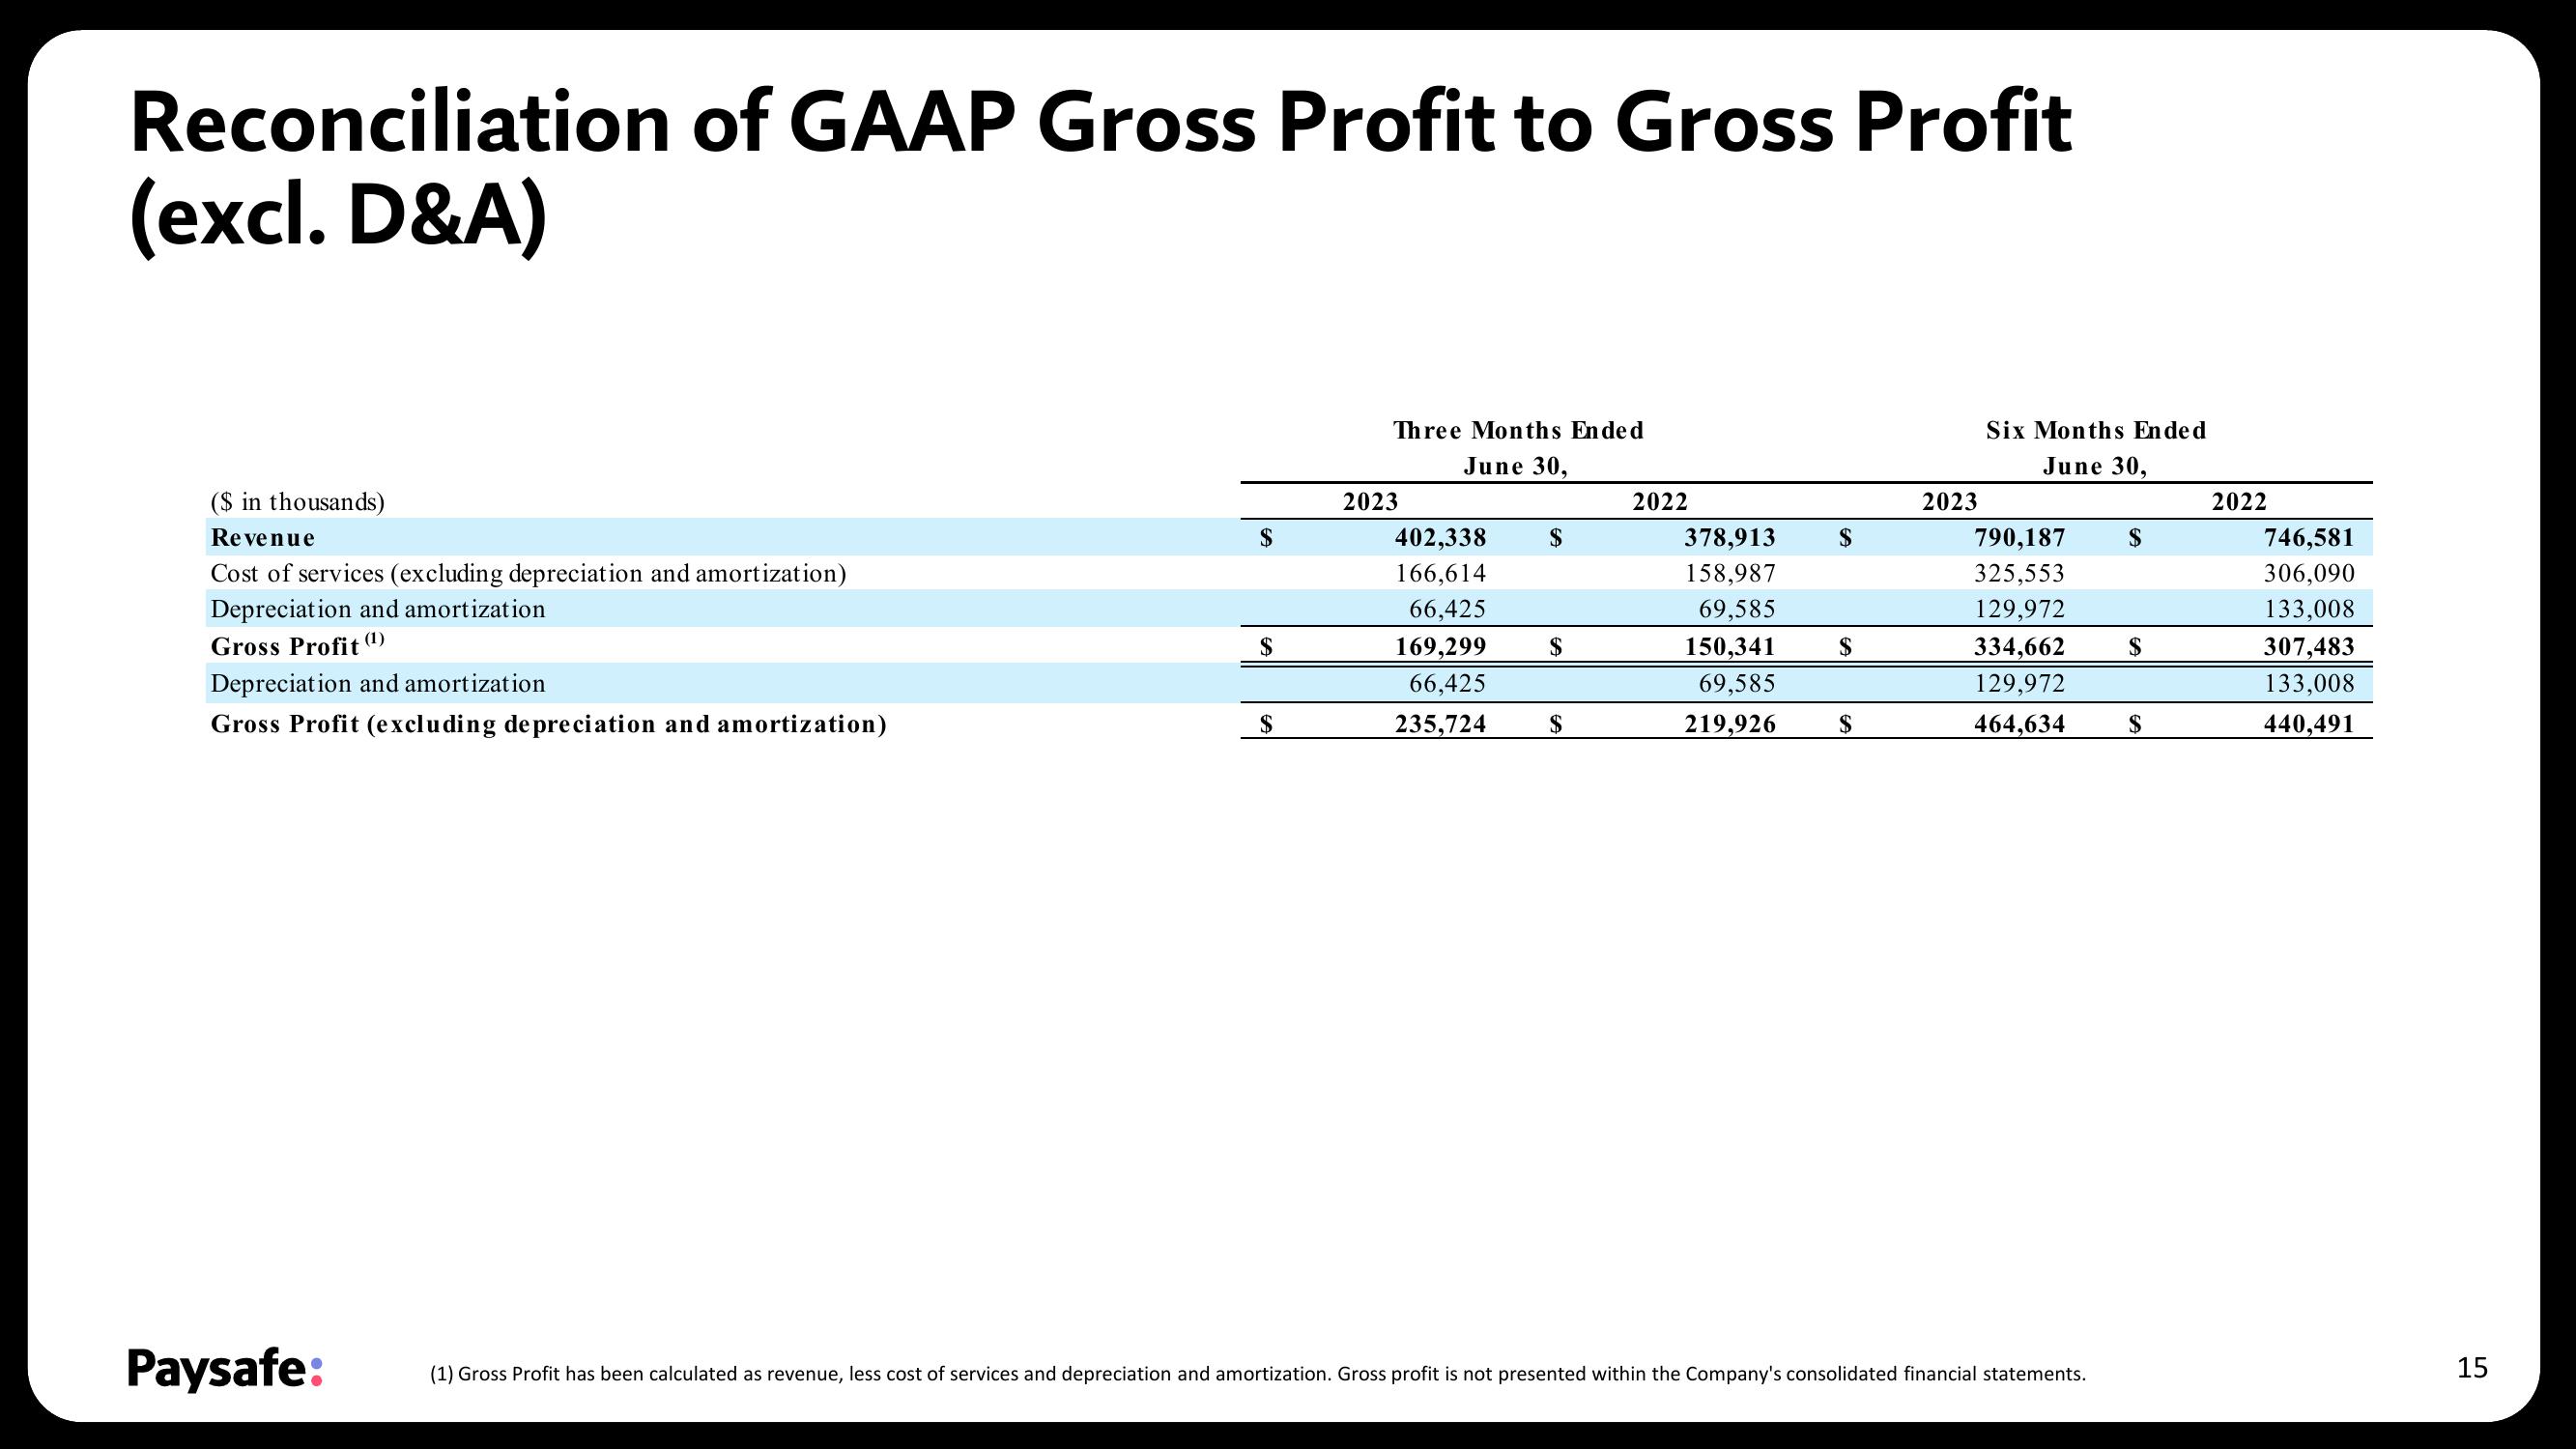
Reconciliation of GAAP Gross Profit to Gross Profit
(excl. D&A)
($ in thousands)
Revenue
Cost of services (excluding depreciation and amortization)
Depreciation and amortization
Gross Profit (¹)
Depreciation and amortization
Gross Profit (excluding depreciation and amortization)
Paysafe:
$
$
$
Three Months Ended
June 30,
2023
402,338
166,614
66,425
169,299
66,425
235,724
$
$
$
2022
378,913
158,987
69,585
150,341
69,585
219,926
$
$
2023
Six Months Ended
June 30,
790,187
325,553
129,972
334,662
129,972
464,634 $
(1) Gross Profit has been calculated as revenue, less cost of services and depreciation and amortization. Gross profit is not presented within the Company's consolidated financial statements.
$
$
2022
746,581
306,090
133,008
307,483
133,008
440,491
15View entire presentation