Factset Results Presentation Deck
FACTSET
Non-GAAP Reconciliations
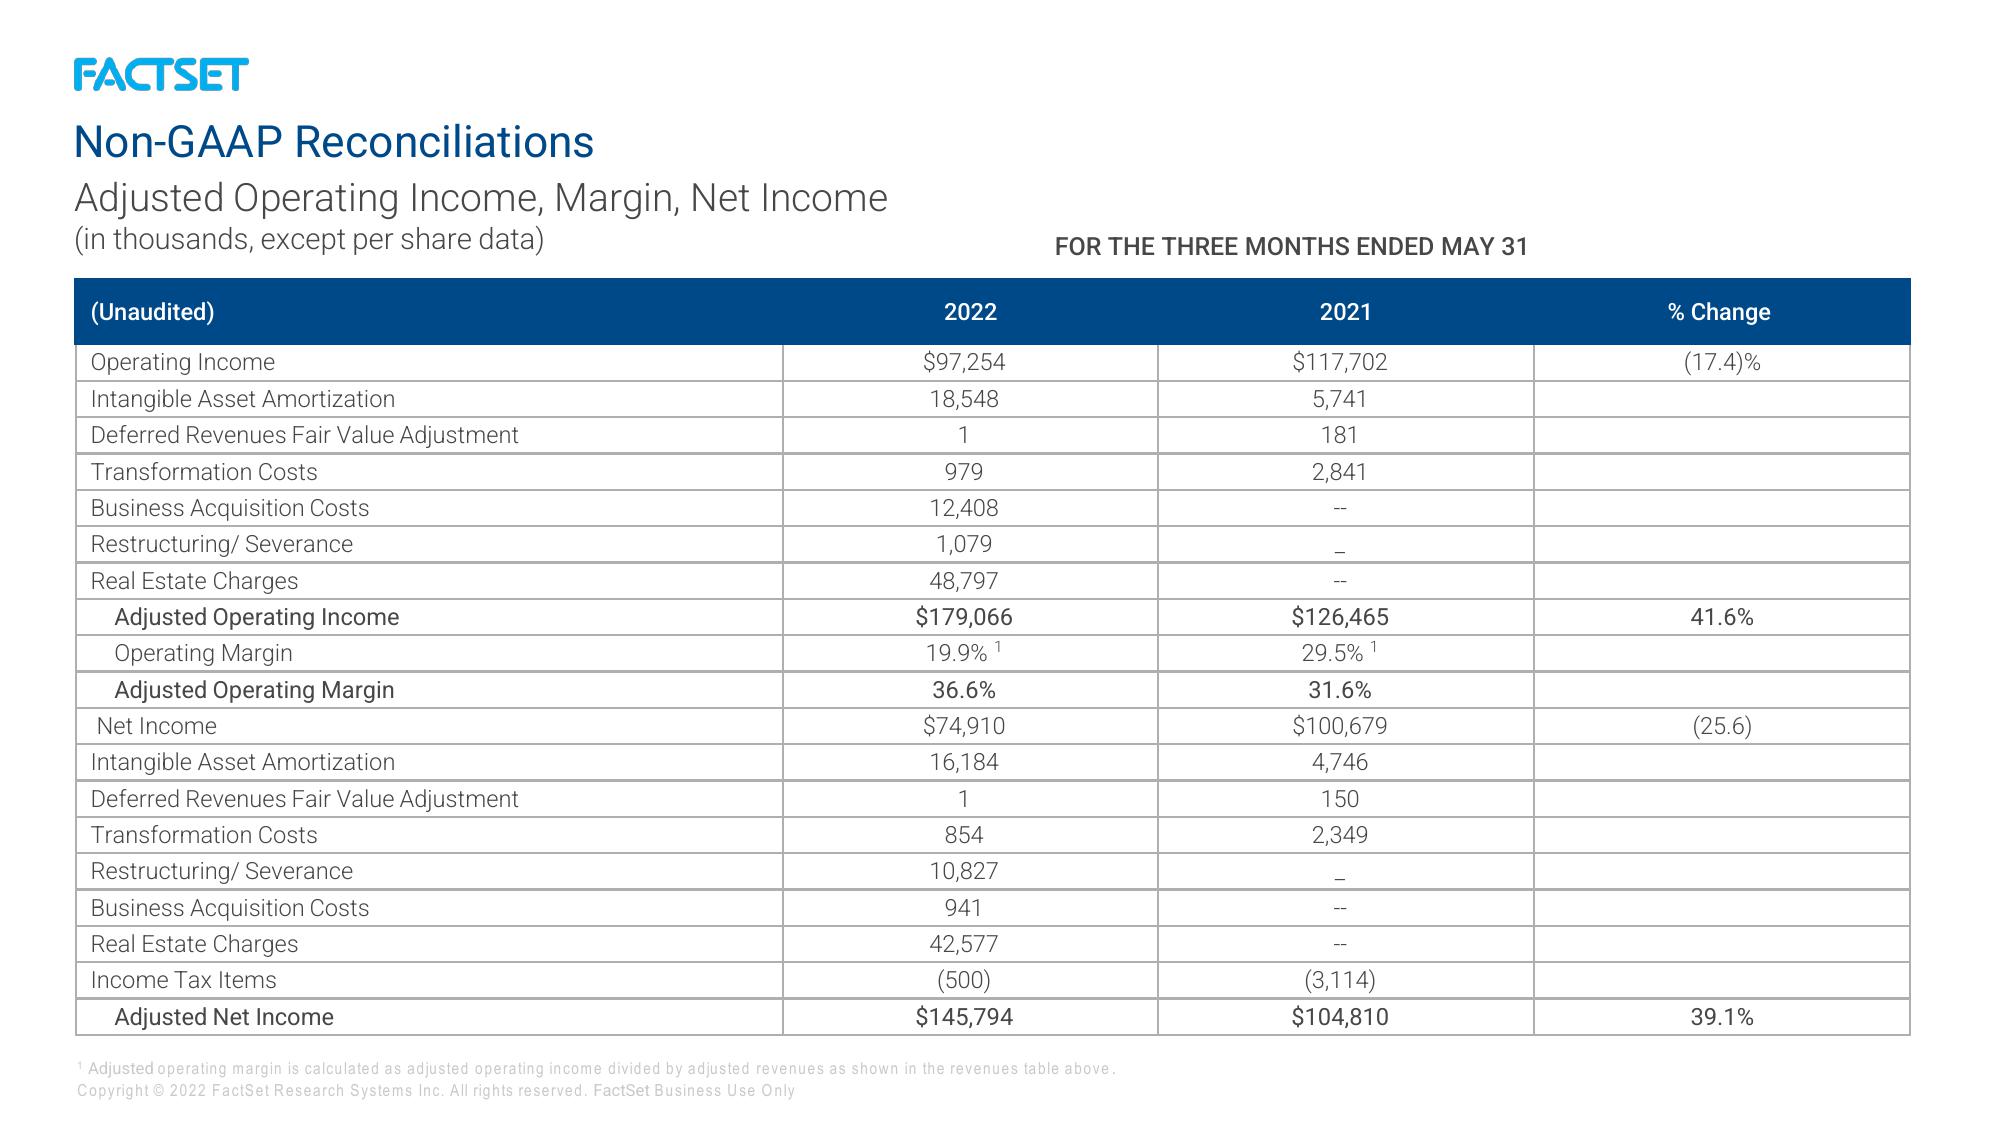
Adjusted Operating Income, Margin, Net Income
(in thousands, except per share data)
(Unaudited)
Operating Income
Intangible Asset Amortization
Deferred Revenues Fair Value Adjustment
Transformation Costs
Business Acquisition Costs
Restructuring/ Severance
Real Estate Charges
Adjusted Operating Income
Operating Margin
Adjusted Operating Margin
Net Income
Intangible Asset Amortization
Deferred Revenues Fair Value Adjustment
Transformation Costs
Restructuring/ Severance
Business Acquisition Costs
Real Estate Charges
Income Tax Items
Adjusted Net Income
2022
$97,254
18,548
1
979
12,408
1,079
48,797
$179,066
19.9% ¹
36.6%
$74,910
16,184
1
854
10,827
941
42,577
(500)
$145,794
FOR THE THREE MONTHS ENDED MAY 31
1 Adjusted operating margin is calculated as adjusted operating income divided by adjusted revenues as shown in the revenues table above.
Copyright © 2022 FactSet Research Systems Inc. All rights reserved. FactSet Business Use Only
2021
$117,702
5,741
181
2,841
$126,465
29.5% 1
31.6%
$100,679
4,746
150
2,349
(3,114)
$104,810
% Change
(17.4)%
41.6%
(25.6)
39.1%View entire presentation