Goldman Sachs Investment Banking Pitch Book
Goldman
Sachs
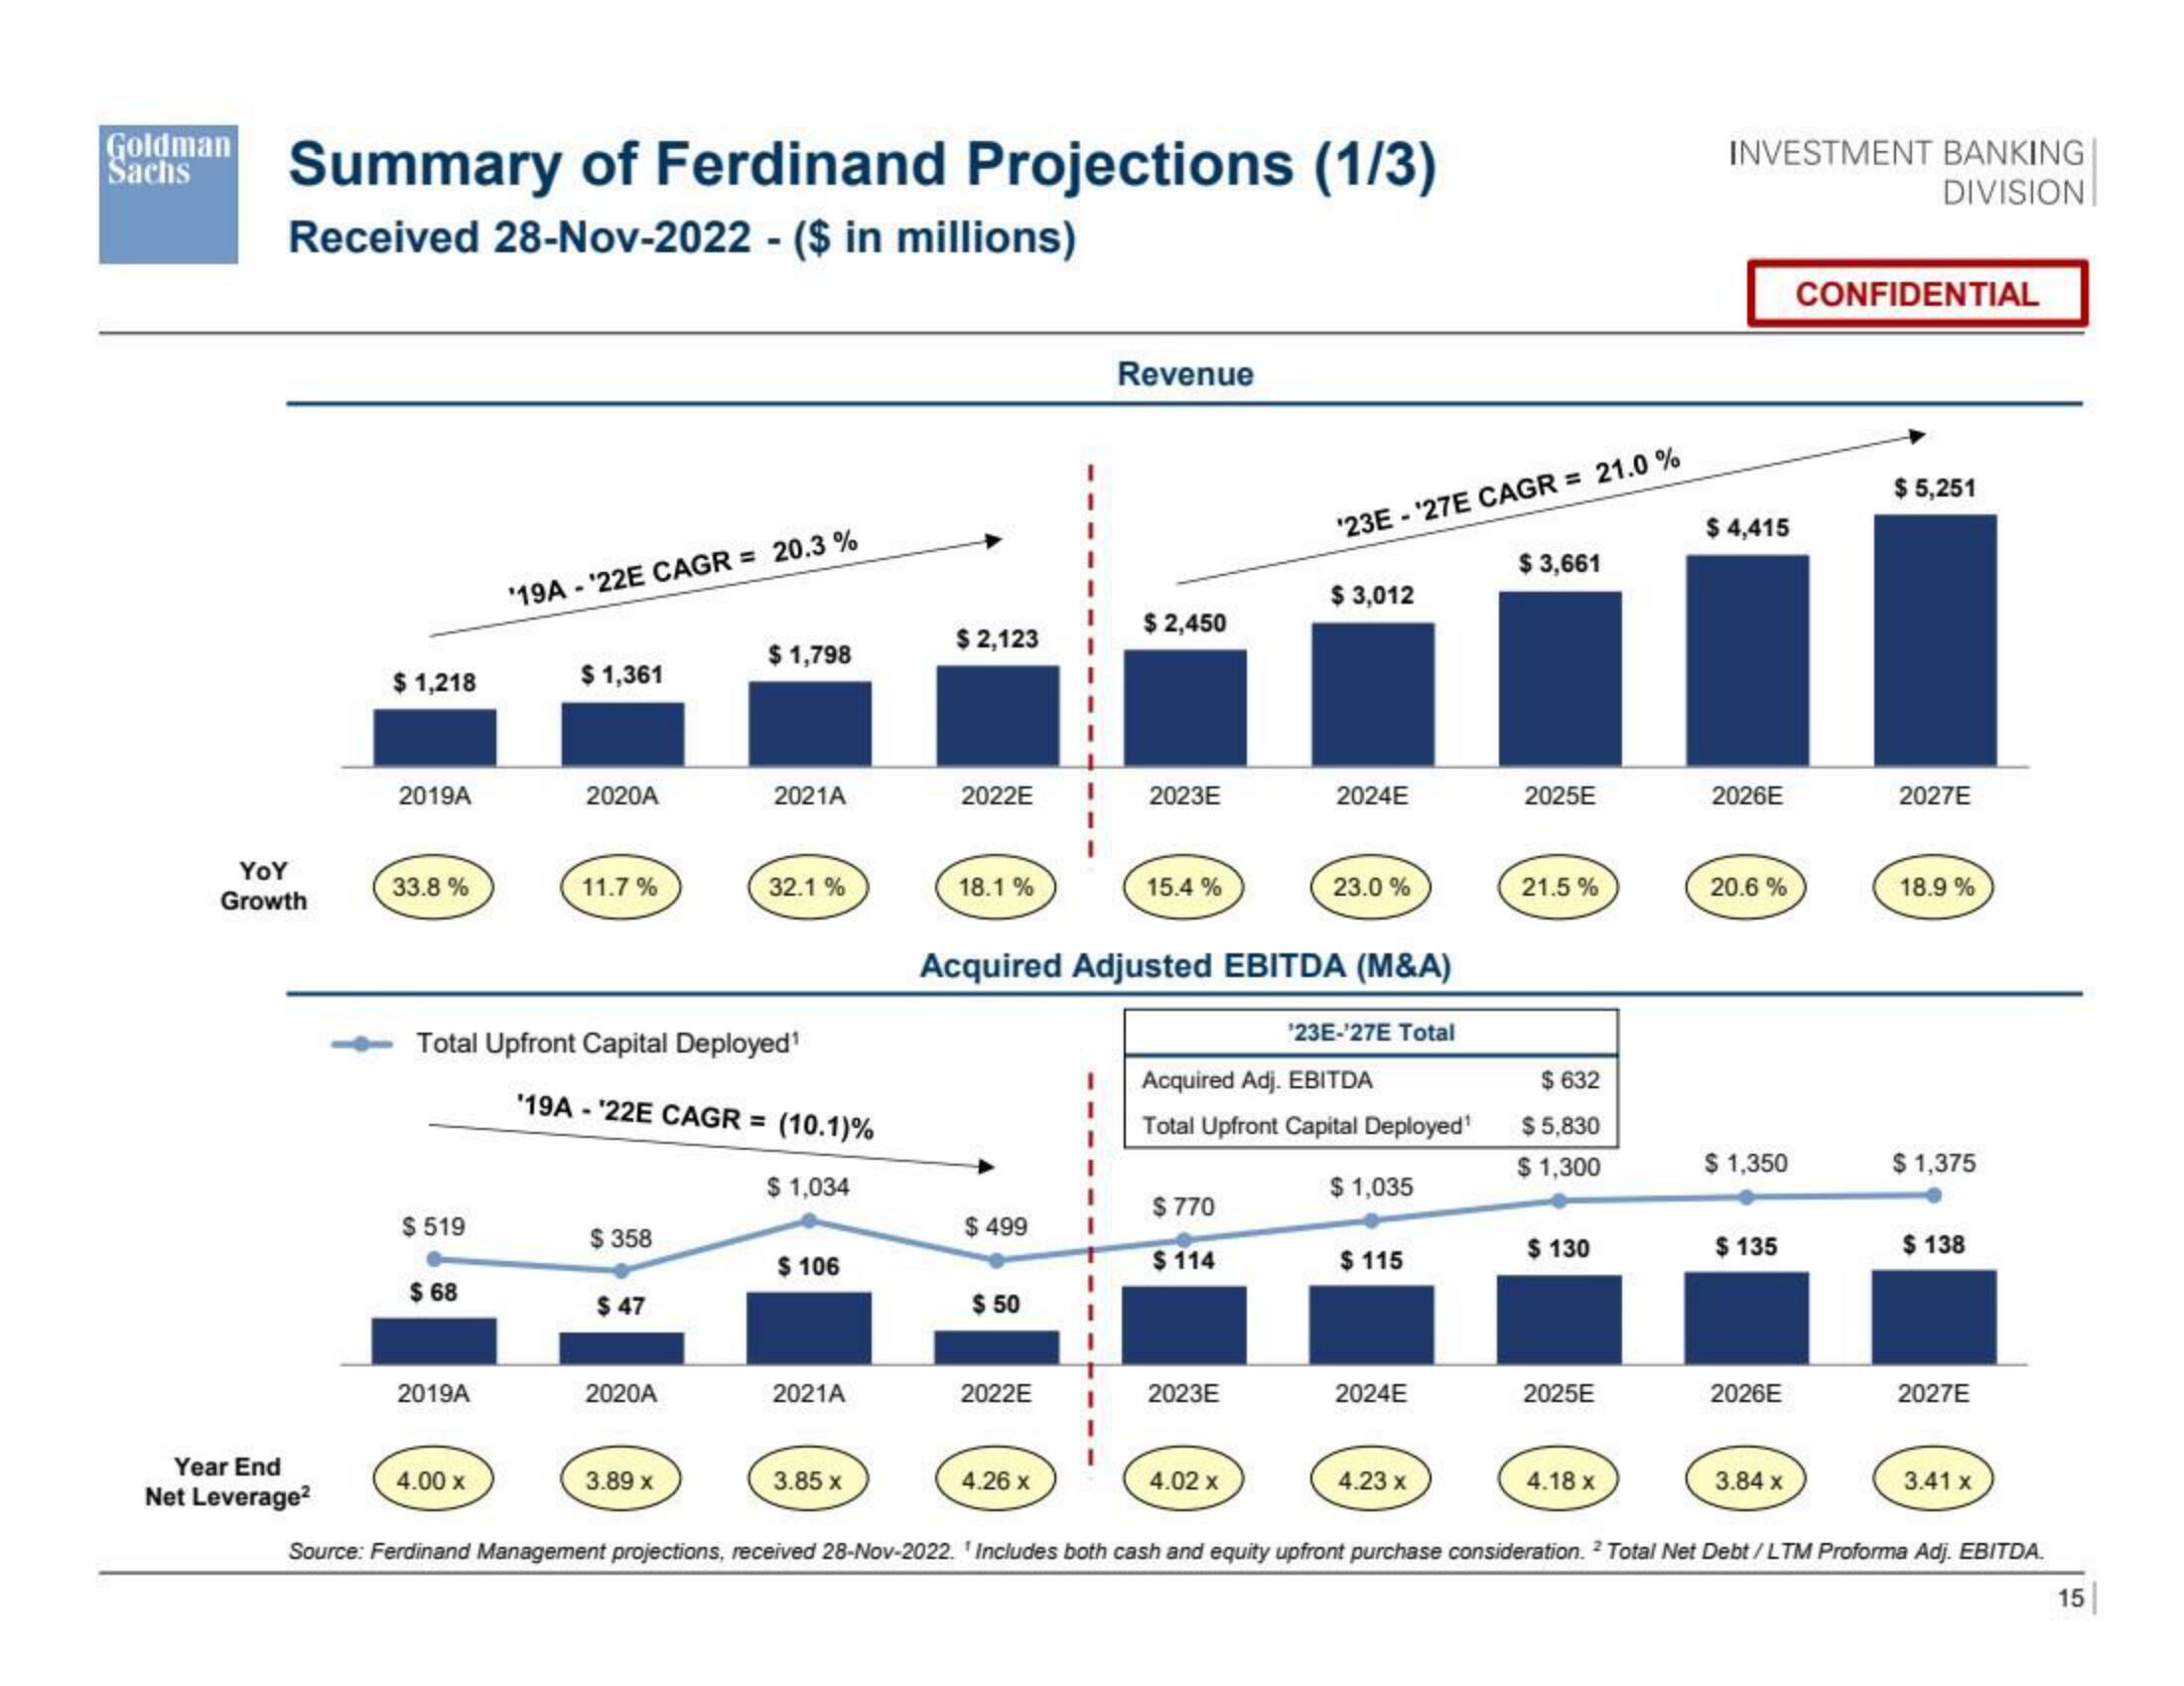
Summary of Ferdinand Projections (1/3)
Received 28-Nov-2022 - ($ in millions)
YOY
Growth
Year End
Net Leverage²
$ 1,218
2019A
33.8 %
$519
$ 68
2019A
'19A -'22E CAGR = 20.3 %
4.00 x
$ 1,361
2020A
11.7%
Total Upfront Capital Deployed¹
$ 358
$ 47
$1,798
'19A-'22E CAGR = (10.1)%
$ 1,034
2020A
2021A
3.89 x
32.1%
$ 106
2021A
3.85 x
$ 2,123
2022E
18.1%
$ 499
$50
2022E
Revenue
4.26 x
$ 2,450
2023E
15.4%
Acquired Adjusted EBITDA (M&A)
$770
$114
'23E-'27E CAGR = 21.0 %
2023E
$ 3,012
4.02 x
2024E
¹23E-¹27E Total
Acquired Adj. EBITDA
Total Upfront Capital Deployed¹
$ 1,035
23.0%
$115
2024E
4.23 x
$3,661
2025E
21.5%
$632
$5,830
$ 1,300
$130
2025E
4.18 x
INVESTMENT BANKING
DIVISION
$ 4,415
2026E
20.6 %
$ 1,350
$ 135
2026E
3.84 x
CONFIDENTIAL
$ 5,251
2027E
18.9%
$ 1,375
$ 138
2027E
3.41 x
Source: Ferdinand Management projections, received 28-Nov-2022. Includes both cash and equity upfront purchase consideration. 2 Total Net Debt/LTM Proforma Adj. EBITDA.
15View entire presentation