Udemy Results Presentation Deck
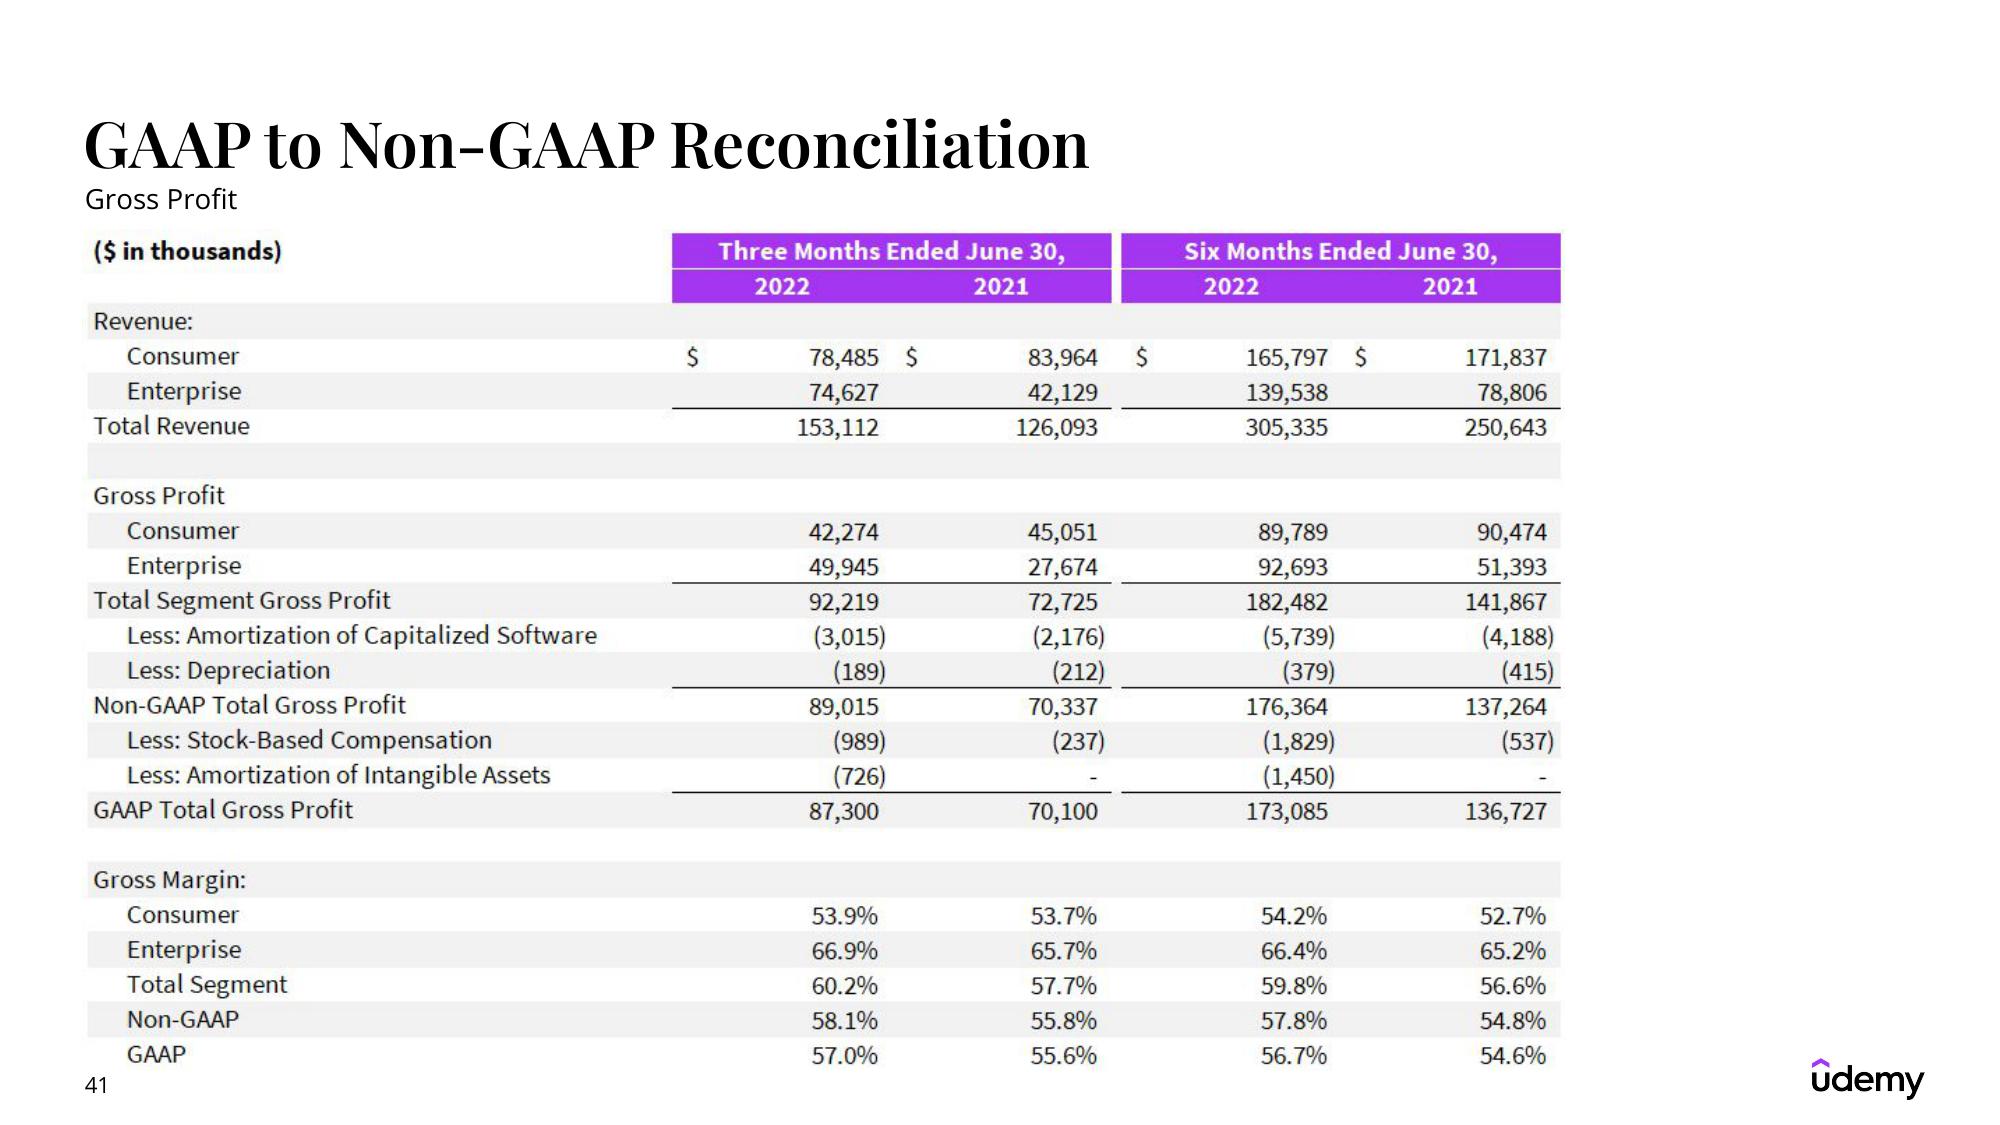
GAAP to Non-GAAP Reconciliation
Gross Profit
($ in thousands)
Revenue:
Consumer
Enterprise
Total Revenue
Gross Profit
Consumer
Enterprise
Total Segment Gross Profit
Less: Amortization of Capitalized Software
Less: Depreciation
Non-GAAP Total Gross Profit
Less: Stock-Based Compensation
Less: Amortization of Intangible Assets
GAAP Total Gross Profit
Gross Margin:
Consumer
Enterprise
Total Segment
Non-GAAP
GAAP
41
Three Months Ended June 30,
2022
2021
78,485 $
74,627
153,112
42,274
49,945
92,219
(3,015)
(189)
89,015
(989)
(726)
87,300
53.9%
66.9%
60.2%
58.1%
57.0%
83,964 $
42,129
126,093
45,051
27,674
72,725
(2,176)
(212)
70,337
(237)
70,100
53.7%
65.7%
57.7%
55.8%
55.6%
Six Months Ended June 30,
2022
2021
165,797 $
139,538
305,335
89,789
92,693
182,482
(5,739)
(379)
176,364
(1,829)
(1,450)
173,085
54.2%
66.4%
59.8%
57.8%
56.7%
171,837
78,806
250,643
90,474
51,393
141,867
(4,188)
(415)
137,264
(537)
136,727
52.7%
65.2%
56.6%
54.8%
54.6%
ûdemyView entire presentation