Acast Results Presentation Deck
Listens
Listens in Millions
-ARPL (1)
.
.
●
701
0,14
Q2-20
Listens Monetization Continues to Improve
+26%
880
0,26
Q2-21
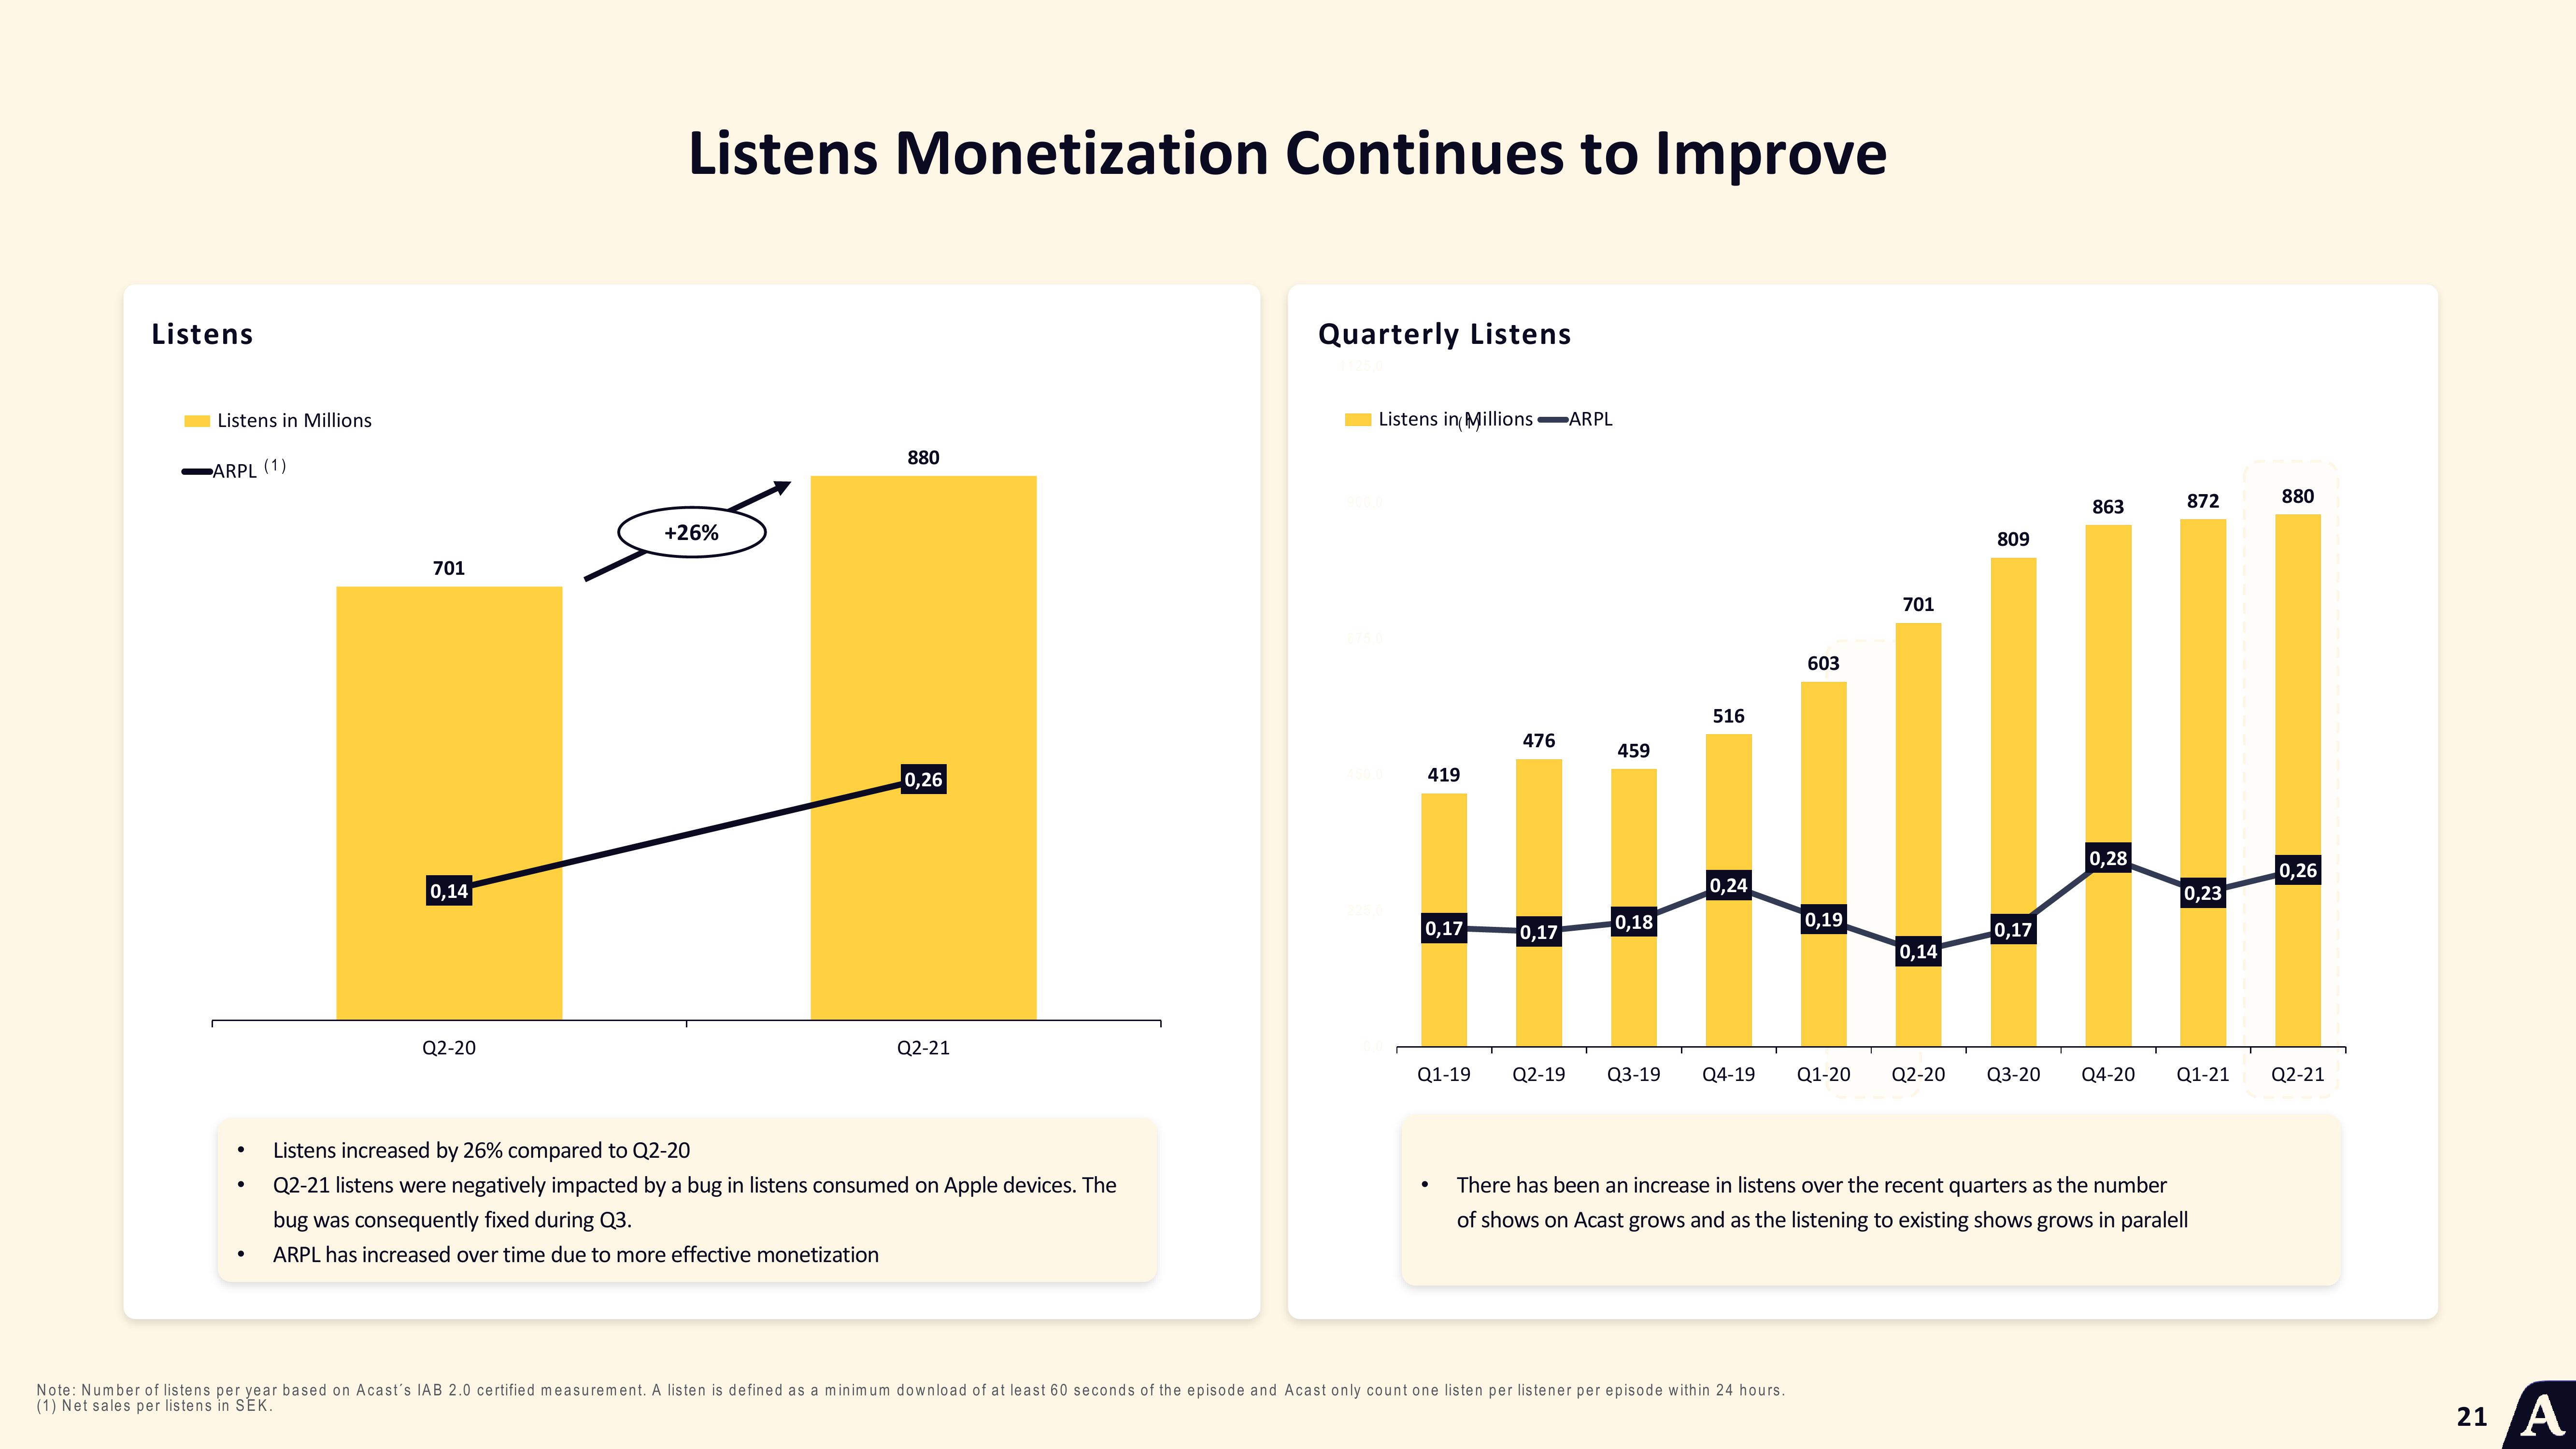
Listens increased by 26% compared to Q2-20
Q2-21 listens were negatively impacted by a bug in listens consumed on Apple devices. The
bug was consequently fixed during Q3.
ARPL has increased over time due to more effective monetization
Quarterly Listens
Listens in Millions -ARPL
419
0,17
476
0,17
459
0,18
516
0,241
603
0,19
Note: Number of listens per year based on Acast's IAB 2.0 certified measurement. A listen is defined as a minimum download of at least 60 seconds of the episode and Acast only count one listen per listener per episode within 24 hours.
(1) Net sales per listens in SEK.
701
|0,14
809
0,17
863
0,28
Q1-19 Q2-19 Q3-19 Q4-19 Q1-20 Q2-20 Q3-20 Q4-20
872
0,23
Q1-21
There has been an increase in listens over the recent quarters as the number
of shows on Acast grows and as the listening to existing shows grows in paralell
880
0,26
Q2-21
21 AView entire presentation