SmileDirectClub Investor Presentation Deck
Marketing & Selling.
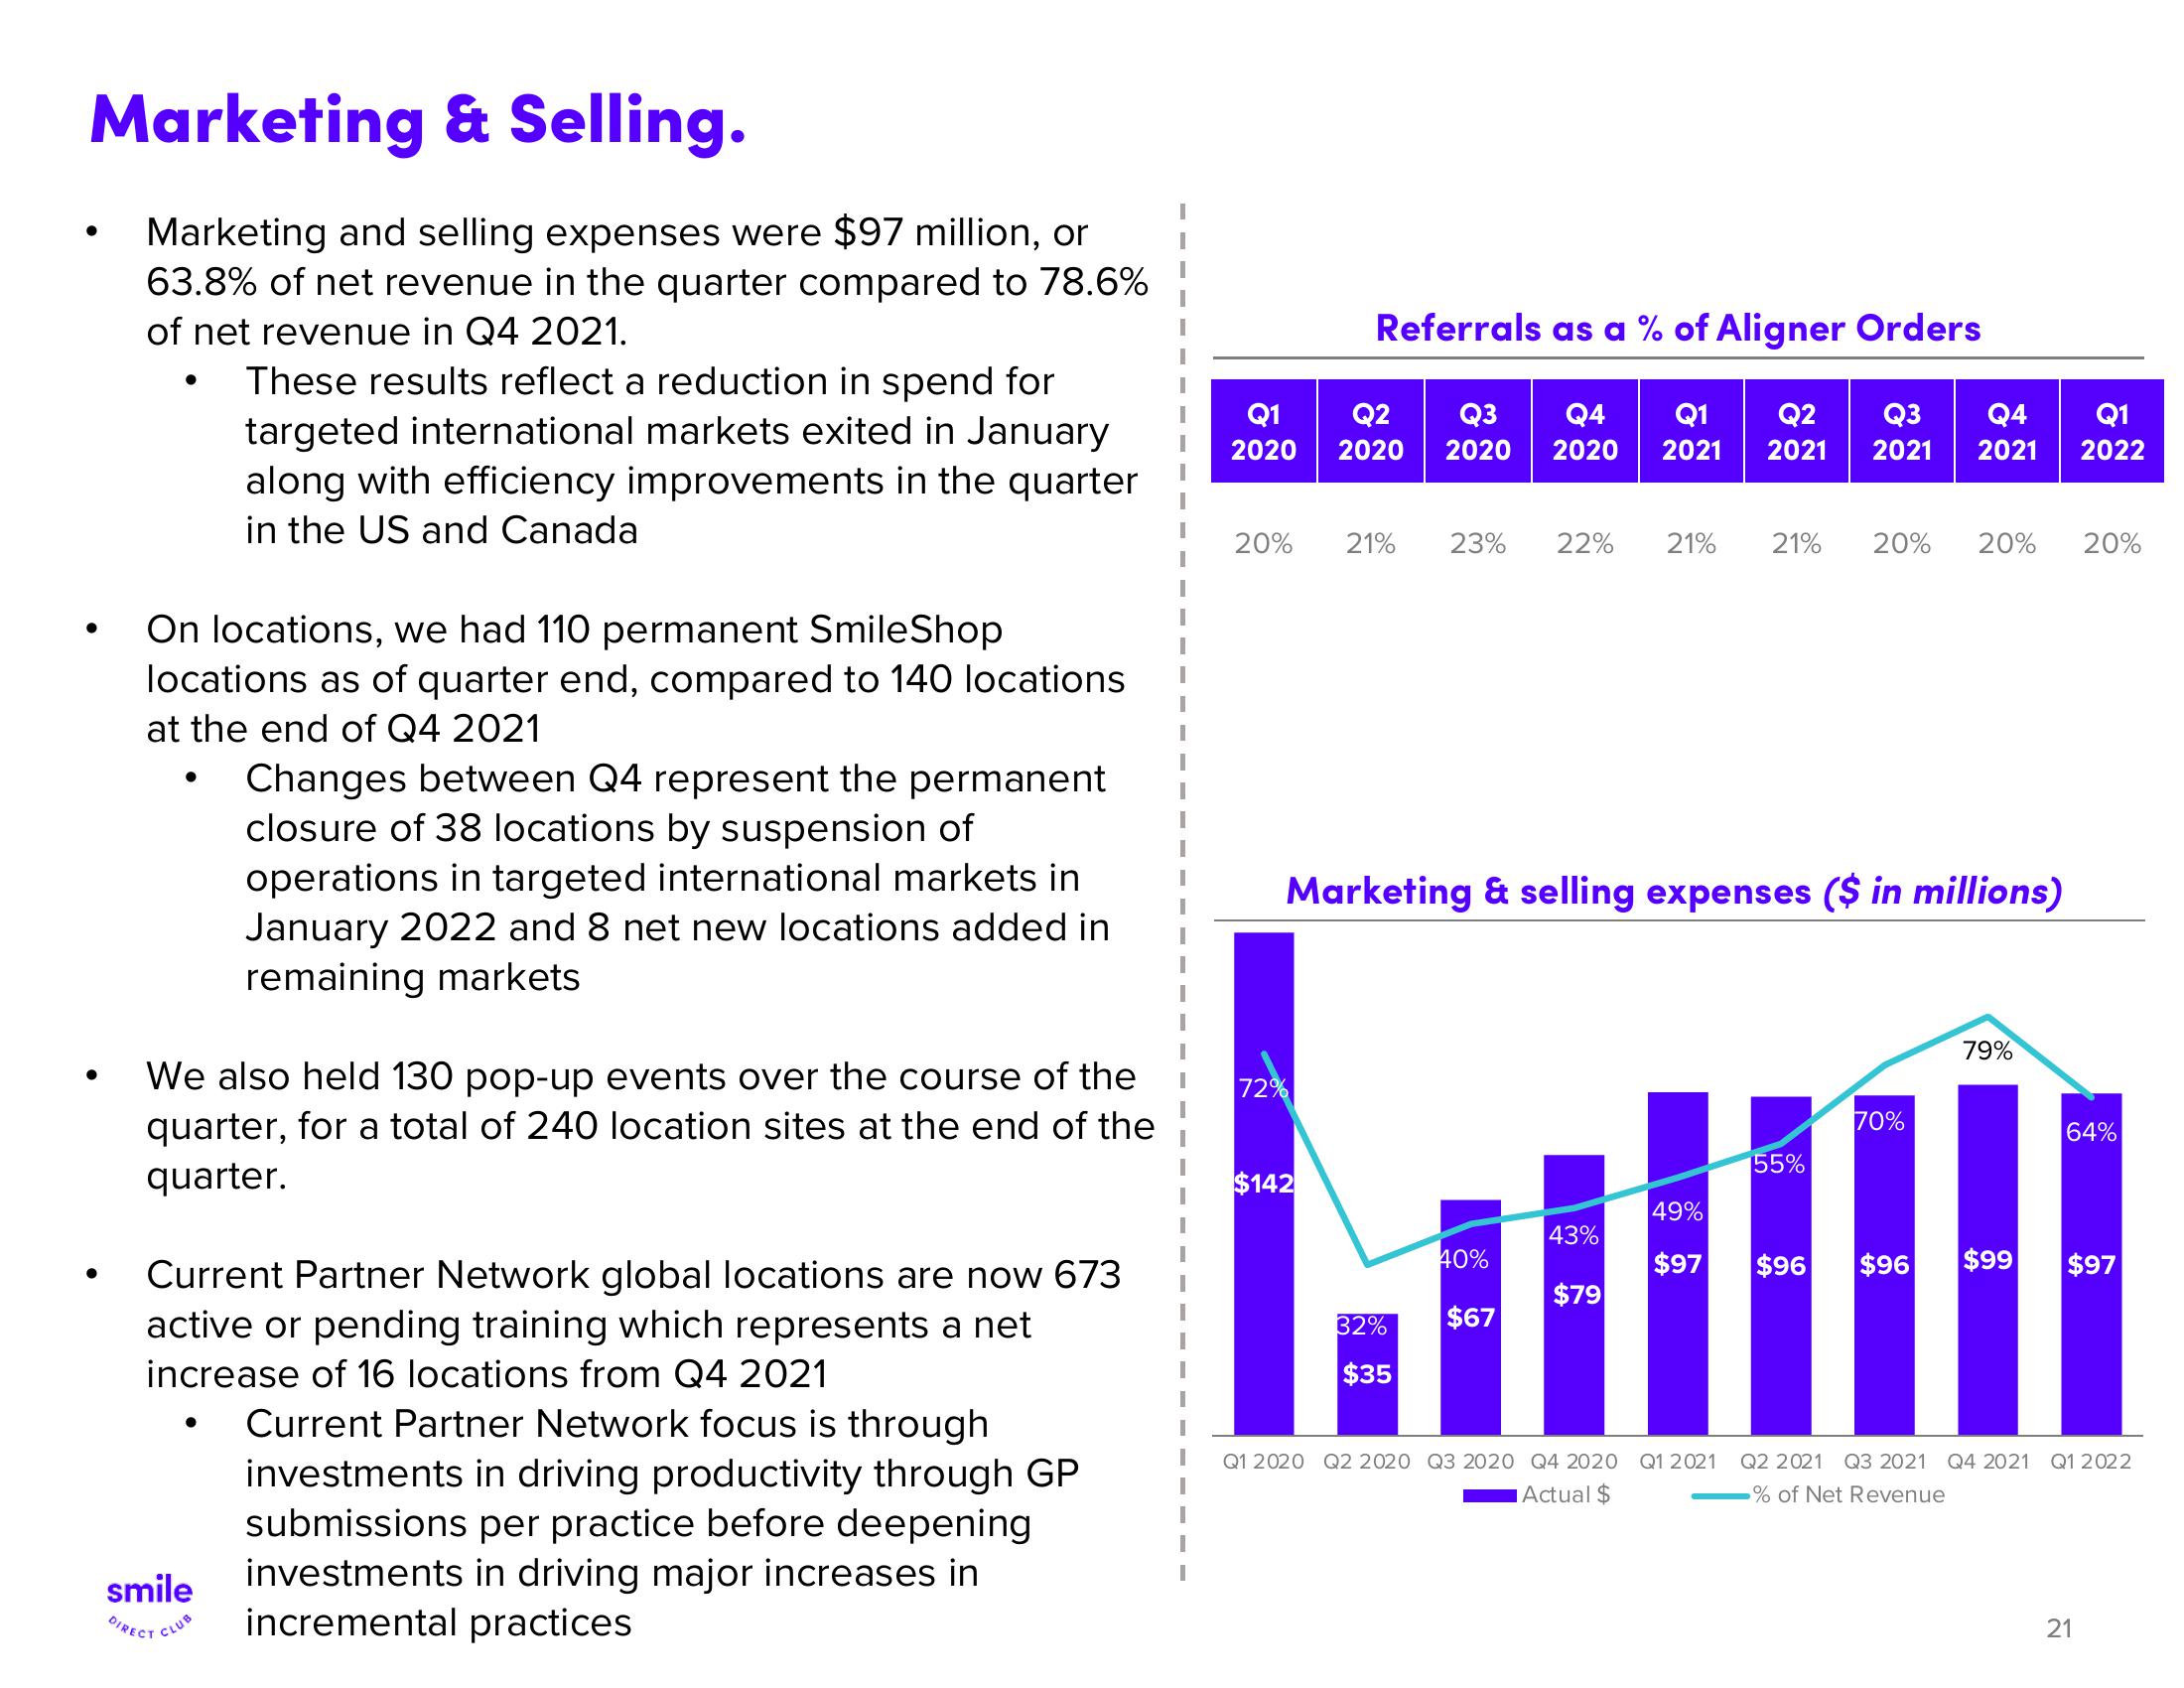
Marketing and selling expenses were $97 million, or
63.8% of net revenue in the quarter compared to 78.6%
of net revenue in Q4 2021.
●
On locations, we had 110 permanent SmileShop
locations as of quarter end, compared to 140 locations
at the end of Q4 2021
●
These results reflect a reduction in spend for
targeted international markets exited in January
along with efficiency improvements in the quarter
in the US and Canada
We also held 130 pop-up events over the course of the
quarter, for a total of 240 location sites at the end of the
quarter.
smile
DIRECT
Changes between Q4 represent the permanent
closure of 38 locations by suspension of
operations in targeted international markets in
January 2022 and 8 net new locations added in
remaining markets
now 673
Current Partner Network global locations are
active or pending training which represents a net
increase of 16 locations from Q4 2021
CLUB
Current Partner Network focus is through
investments in driving productivity through GP
submissions per practice before deepening
investments in driving major increases in
incremental practices
Referrals as a % of Aligner Orders
Q1 Q2 Q3 Q4 Q1 Q2 Q3 Q4
2020 2020 2020 2020 2021 2021 2021 2021
20%
72%
Marketing & selling expenses ($ in millions)
55%
Lam
49%
43%
40%
$97 $96 $96 $99
$79
32% $67
21% 23% 22% 21% 21% 20% 20%
$142
$35
70%
79%
Q1
2022
20%
64%
$97
21
Q1 2020 Q2 2020 Q3 2020 Q4 2020 Q1 2021 Q2 2021 Q3 2021 Q4 2021 Q1 2022
Actual $
% of Net RevenueView entire presentation