J.P.Morgan Shareholder Engagement Presentation Deck
B Executive Compensation
The CMDC determined 2022 pay, referencing the Firm's annual and long-term
operating performance and ROTCE, including over the recent pandemic cycle
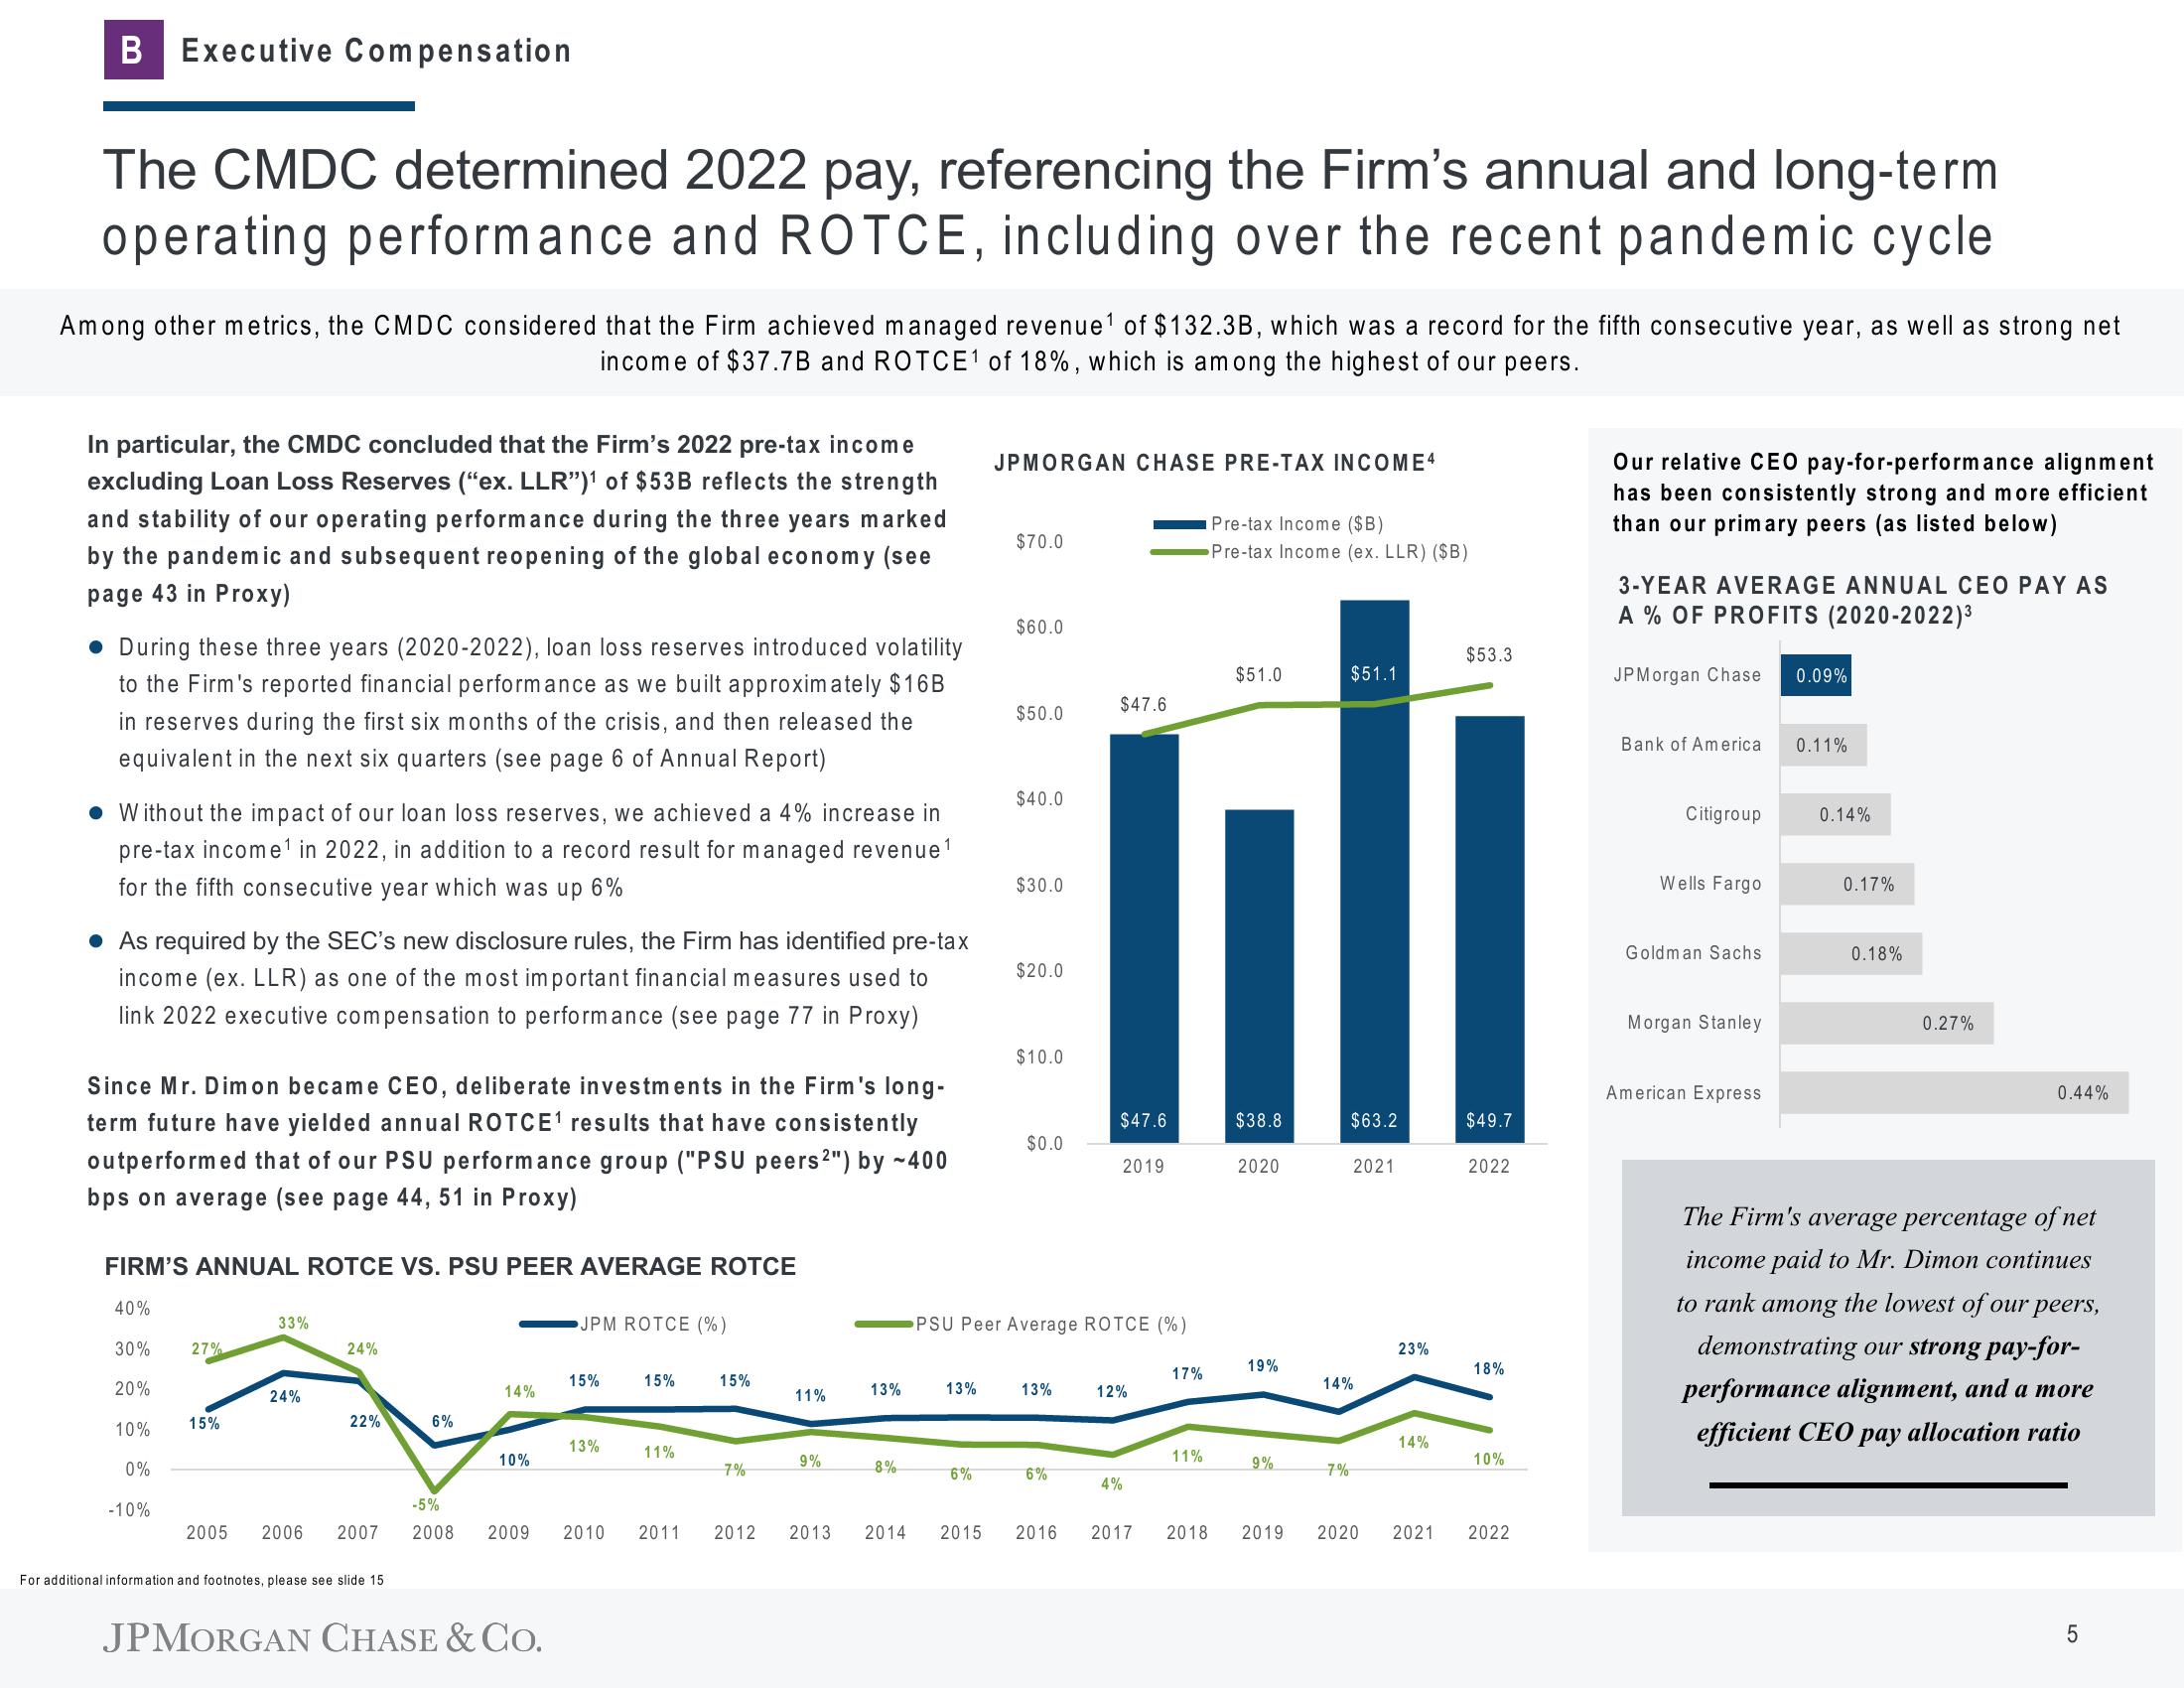
Among other metrics, the CMDC considered that the Firm achieved managed revenue¹ of $132.3B, which was a record for the fifth consecutive year, as well as strong net
income of $37.7B and ROTCE1 of 18%, which is among the highest of our peers.
In particular, the CMDC concluded that the Firm's 2022 pre-tax income
excluding Loan Loss Reserves ("ex. LLR")¹ of $53B reflects the strength
and stability of our operating performance during the three years marked
by the pandemic and subsequent reopening of the global economy (see
page 43 in Proxy)
During these three years (2020-2022), loan loss reserves introduced volatility
to the Firm's reported financial performance as we built approximately $16B
in reserves during the first six months of the crisis, and then released the
equivalent in the next six quarters (see page 6 of Annual Report)
Without the impact of our loan loss reserves, we achieved a 4% increase in
pre-tax income¹ in 2022, in addition to a record result for managed revenue ¹
for the fifth consecutive year which was up 6%
• As required by the SEC's new disclosure rules, the Firm has identified pre-tax
income (ex. LLR) as one of the most important financial measures used to
link 2022 executive compensation to performance (see page 77 in Proxy)
Since Mr. Dimon became CEO, deliberate investments in the Firm's long-
term future have yielded annual ROTCE¹ results that have consistently
outperformed that of our PSU performance group ("PSU peers 2") by ~400
bps on average (see page 44, 51 in Proxy)
FIRM'S ANNUAL ROTCE VS. PSU PEER AVERAGE ROTCE
40%
30%
20%
10%
0%
-10%
33%
24%
24%
A
15%
22%
27%
6%
-5%
2005 2006 2007 2008
For additional information and footnotes, please see slide 15
14%
10%
JPM ROTCE (%)
JPMORGAN CHASE & CO.
15%
13%
2009 2010
15%
11%
15%
7%
2011 2012
11%
9%
2013
13%
8%
2014
13%
JPMORGAN CHASE PRE-TAX INCOME4
6%
$70.0
$60.0
$50.0
$40.0
$30.0
$20.0
$10.0
$0.0
PSU Peer Average ROTCE (%)
13%
$47.6
6%
$47.6
2019
12%
4%
2015 2016 2017
17%
11%
2018
Pre-tax Income ($B)
Pre-tax Income (ex. LLR) ($B)
$51.0
$38.8
2020
19%
9%
$51.1
7%
$63.2
2021
14%
23%
14%
$53.3
$49.7
2022
18%
10%
2019 2020 2021 2022
Our relative CEO pay-for-performance alignment
has been consistently strong and more efficient
than our primary peers (as listed below)
3-YEAR AVERAGE ANNUAL CEO PAY AS
A % OF PROFITS (2020-2022)³
JPMorgan Chase
Bank of America
Citigroup
Wells Fargo
Goldman Sachs
Morgan Stanley
American Express
0.09%
0.11%
0.14%
0.17%
0.18%
0.27%
0.44%
The Firm's average percentage of net
income paid to Mr. Dimon continues
to rank among the lowest of our peers,
demonstrating our strong pay-for-
performance alignment, and a more
efficient CEO pay allocation ratio
LO
5View entire presentation