Inovalon Results Presentation Deck
Revenue Guidance Bridge
Previously provided on February 22, 2017.
inovalon
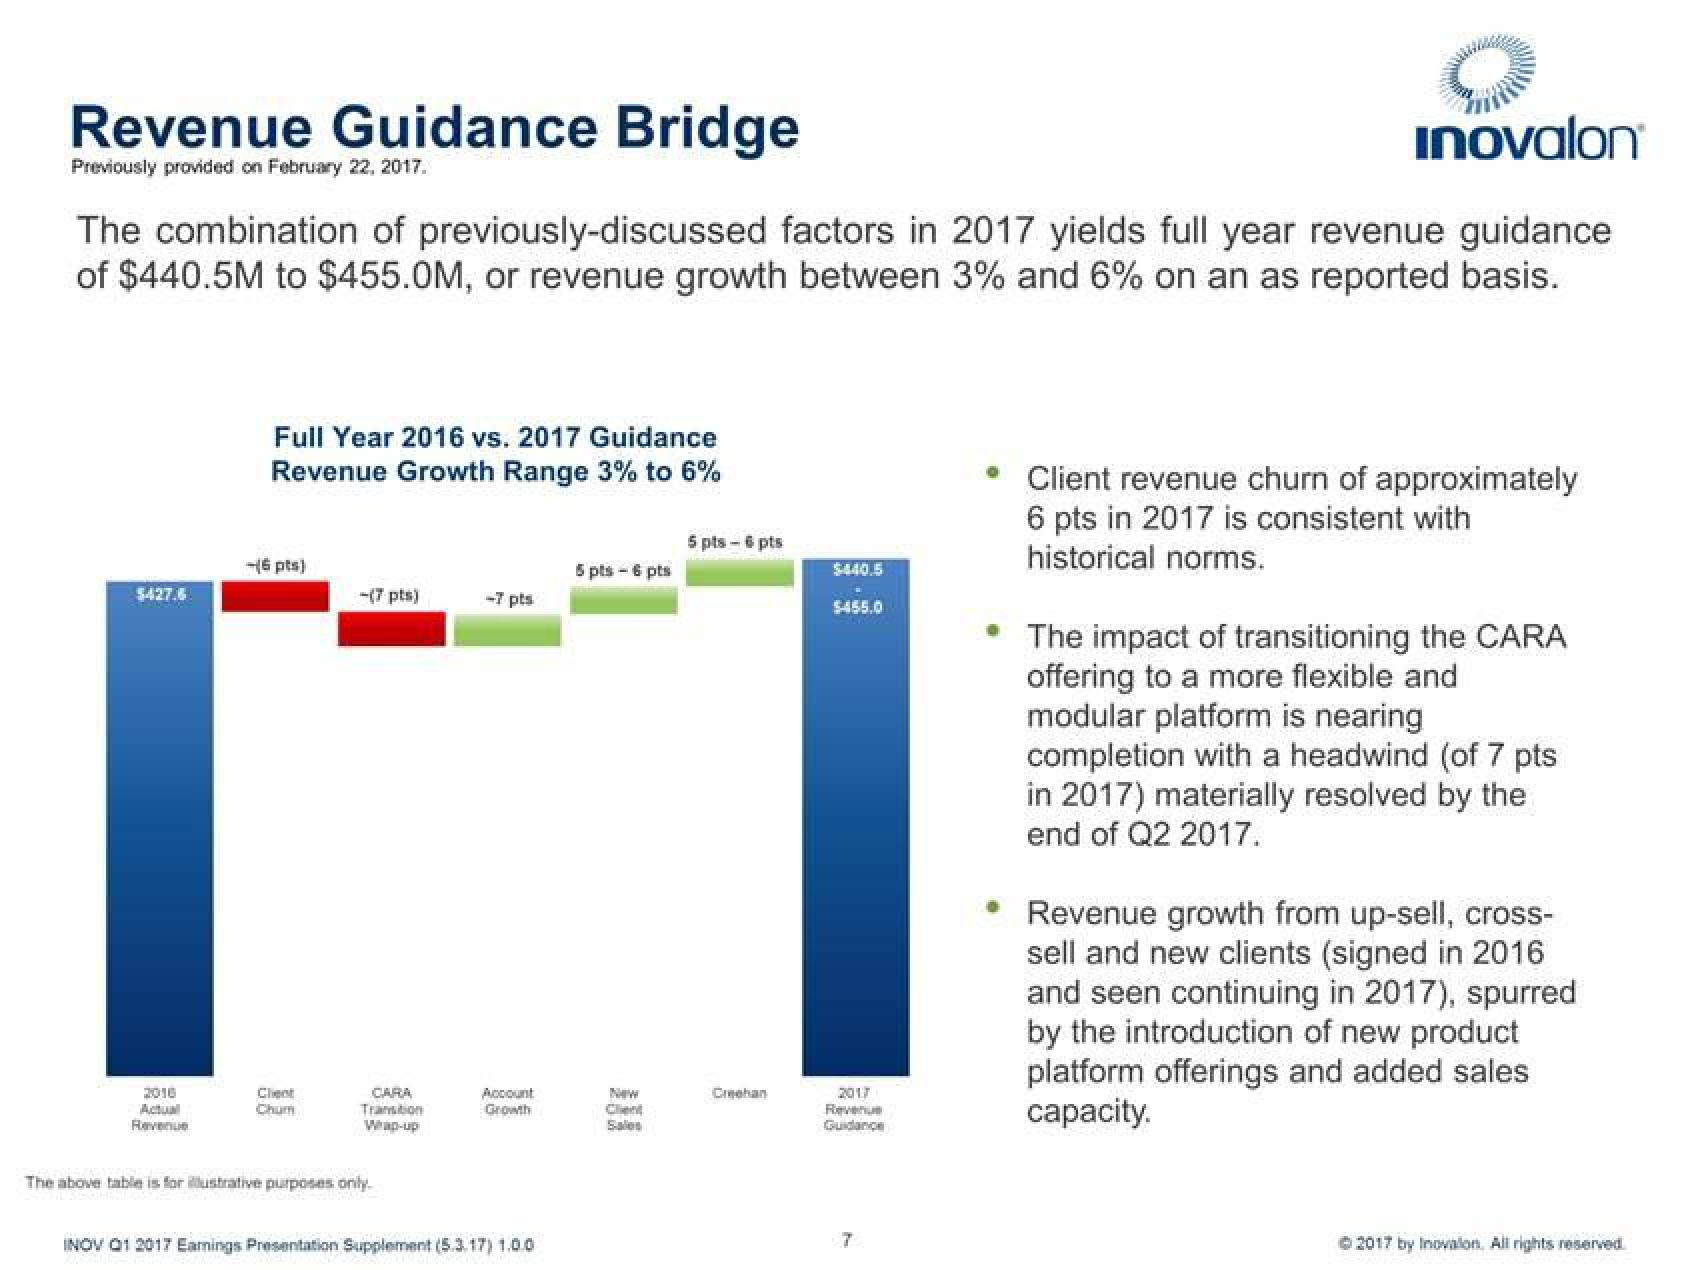
The combination of previously-discussed factors in 2017 yields full year revenue guidance
of $440.5M to $455.0M, or revenue growth between 3% and 6% on an as reported basis.
$427.6
2010
Actual
Revenue
Full Year 2016 vs. 2017 Guidance
Revenue Growth Range 3% to 6%
-(6 pts)
Client
Chum
-(7 pts)
CARA
Transition
Wap-up
The above table is for illustrative purposes only.
-7 pts
Account
Growth
INOV 01 2017 Earnings Presentation Supplement (5.3.17) 1.0.0
5 pts - 6 pts
New
Sales
5 pts - 6 pts
Creehan
$440.5
.
$455.0
2017
Guidance
7
Client revenue churn of approximately
6 pts in 2017 is consistent with
historical norms.
The impact of transitioning the CARA
offering to a more flexible and
modular platform is nearing
completion with a headwind (of 7 pts
in 2017) materially resolved by the
end of Q2 2017.
Revenue growth from up-sell, cross-
sell and new clients (signed in 2016
and seen continuing in 2017), spurred
by the introduction of new product
platform offerings and added sales
capacity.
© 2017 by Inovalon. All rights reservedView entire presentation