Q3 2022 Investor Presentation slide image

Q3 2022 Investor Presentation

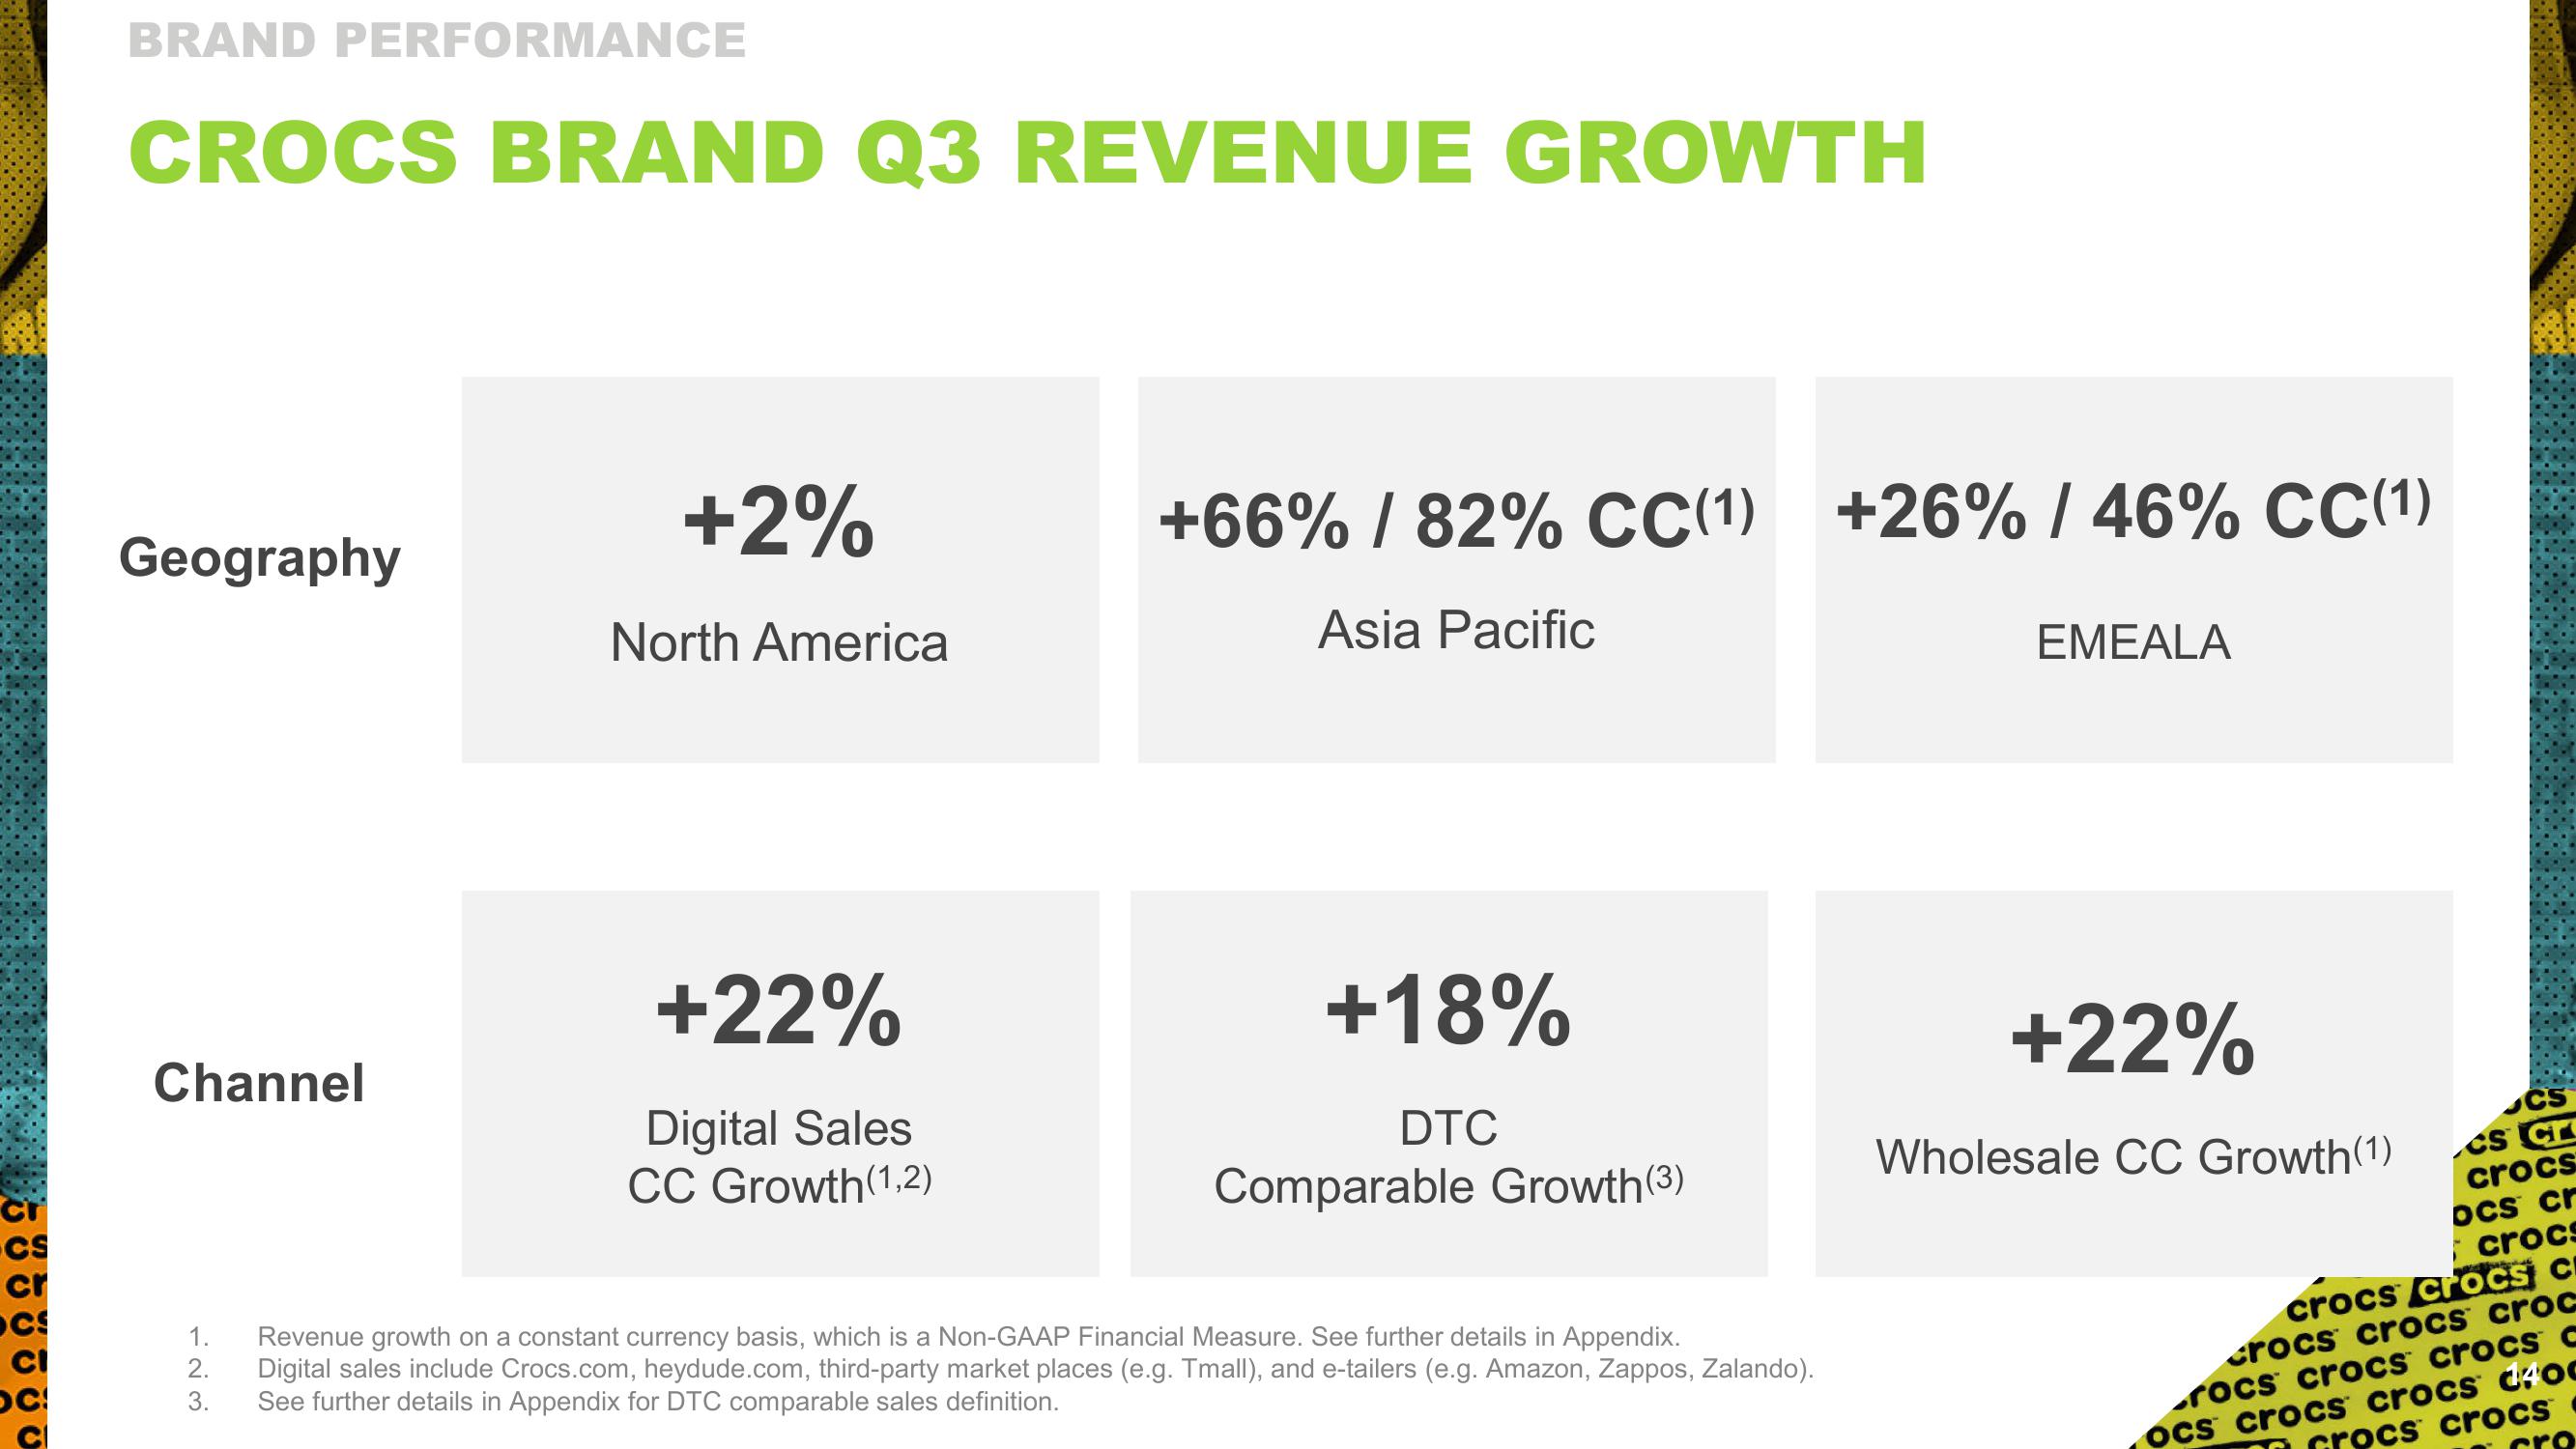
Cr CS cr OCS CI OC BRAND PERFORMANCE CROCS BRAND Q3 REVENUE GROWTH Geography Channel +2% North America +22% Digital Sales CC Growth (1,2) +66% / 82% CC(1) +26% / 46% CC (1) Asia Pacific +18% DTC Comparable Growth (3) 1. Revenue growth on a constant currency basis, which is a Non-GAAP Financial Measure. See further details in Appendix. 2. Digital sales include Crocs.com, heydude.com, third-party market places (e.g. Tmall), and e-tailers (e.g. Amazon, Zappos, Zalando). See further details in Appendix for DTC comparable sales definition. 3. EMEALA +22% Wholesale CC Growth(1) CS CS C crocs ocs cr crocs crocs crocs C crocs crocs croc rocs crocs crocs c ocs crocs crocs doc Grocs crocs
View entire presentation