2nd Quarter 2021 Investor Presentation
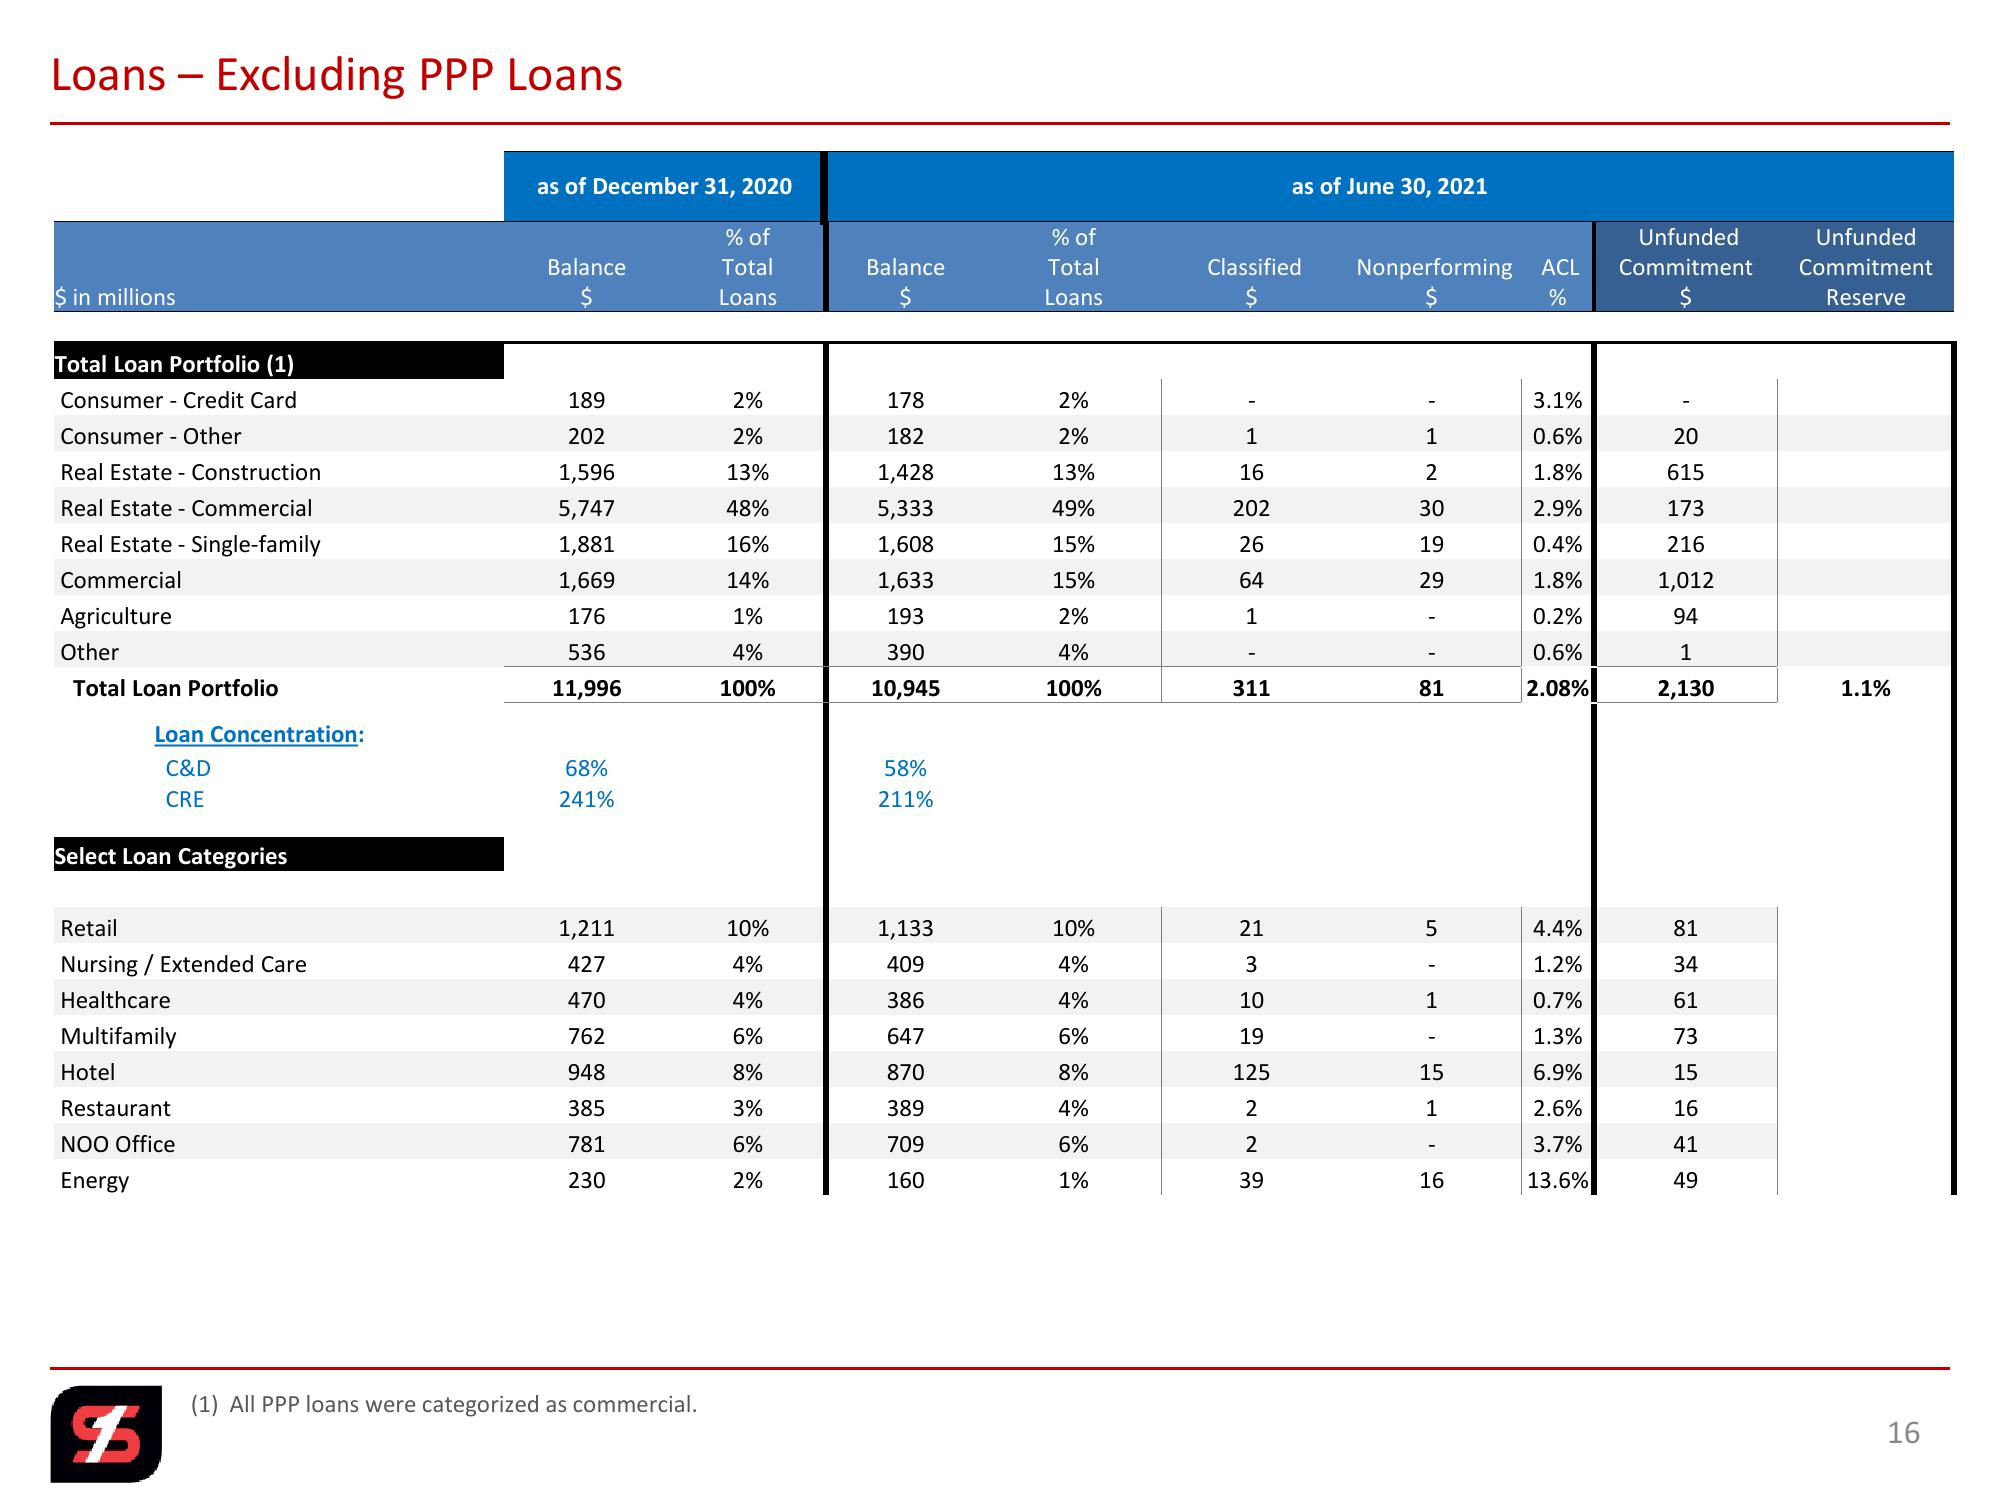
Loans - Excluding PPP Loans
as of December 31, 2020
as of June 30, 2021
% of
% of
$ in millions
Balance
$
Total
Balance
Total
Classified
Loans
$
Loans
$
$
%
Unfunded
Unfunded
Nonperforming ACL Commitment Commitment
$
Reserve
Total Loan Portfolio (1)
Consumer Credit Card
189
2%
178
2%
3.1%
Consumer Other
202
2%
182
2%
1
1
0.6%
20
Real Estate Construction
1,596
13%
1,428
13%
16
2
1.8%
615
Real Estate Commercial
5,747
48%
5,333
49%
202
30
2.9%
173
Real Estate - Single-family
1,881
16%
1,608
15%
26
19
0.4%
216
Commercial
1,669
14%
1,633
15%
64
29
1.8%
1,012
Agriculture
176
1%
193
2%
1
0.2%
94
Other
536
4%
390
4%
-
0.6%
1
Total Loan Portfolio
11,996
100%
10,945
100%
311
81
2.08%
2,130
1.1%
Loan Concentration:
C&D
CRE
68%
241%
58%
211%
Select Loan Categories
Retail
1,211
Nursing/Extended Care
427
Healthcare
470
Multifamily
762
Hotel
Restaurant
NOO Office
Energy
$
948
385
781
230
(1) All PPP loans were categorized as commercial.
សំ ៖ ៖ ៖ ៖ ៖ ៖ ៖
10%
1,133
10%
21
409
4%
4%
386
4%
10
647
6%
19
870
8%
125
389
4%
709
160
6%
die de de
1%
39
23222222
5
4.4%
81
-
1.2%
34
1
0.7%
61
1.3%
73
15
6.9%
15
1
2.6%
16
3.7%
41
16
13.6%
49
16View entire presentation