Inovalon Results Presentation Deck
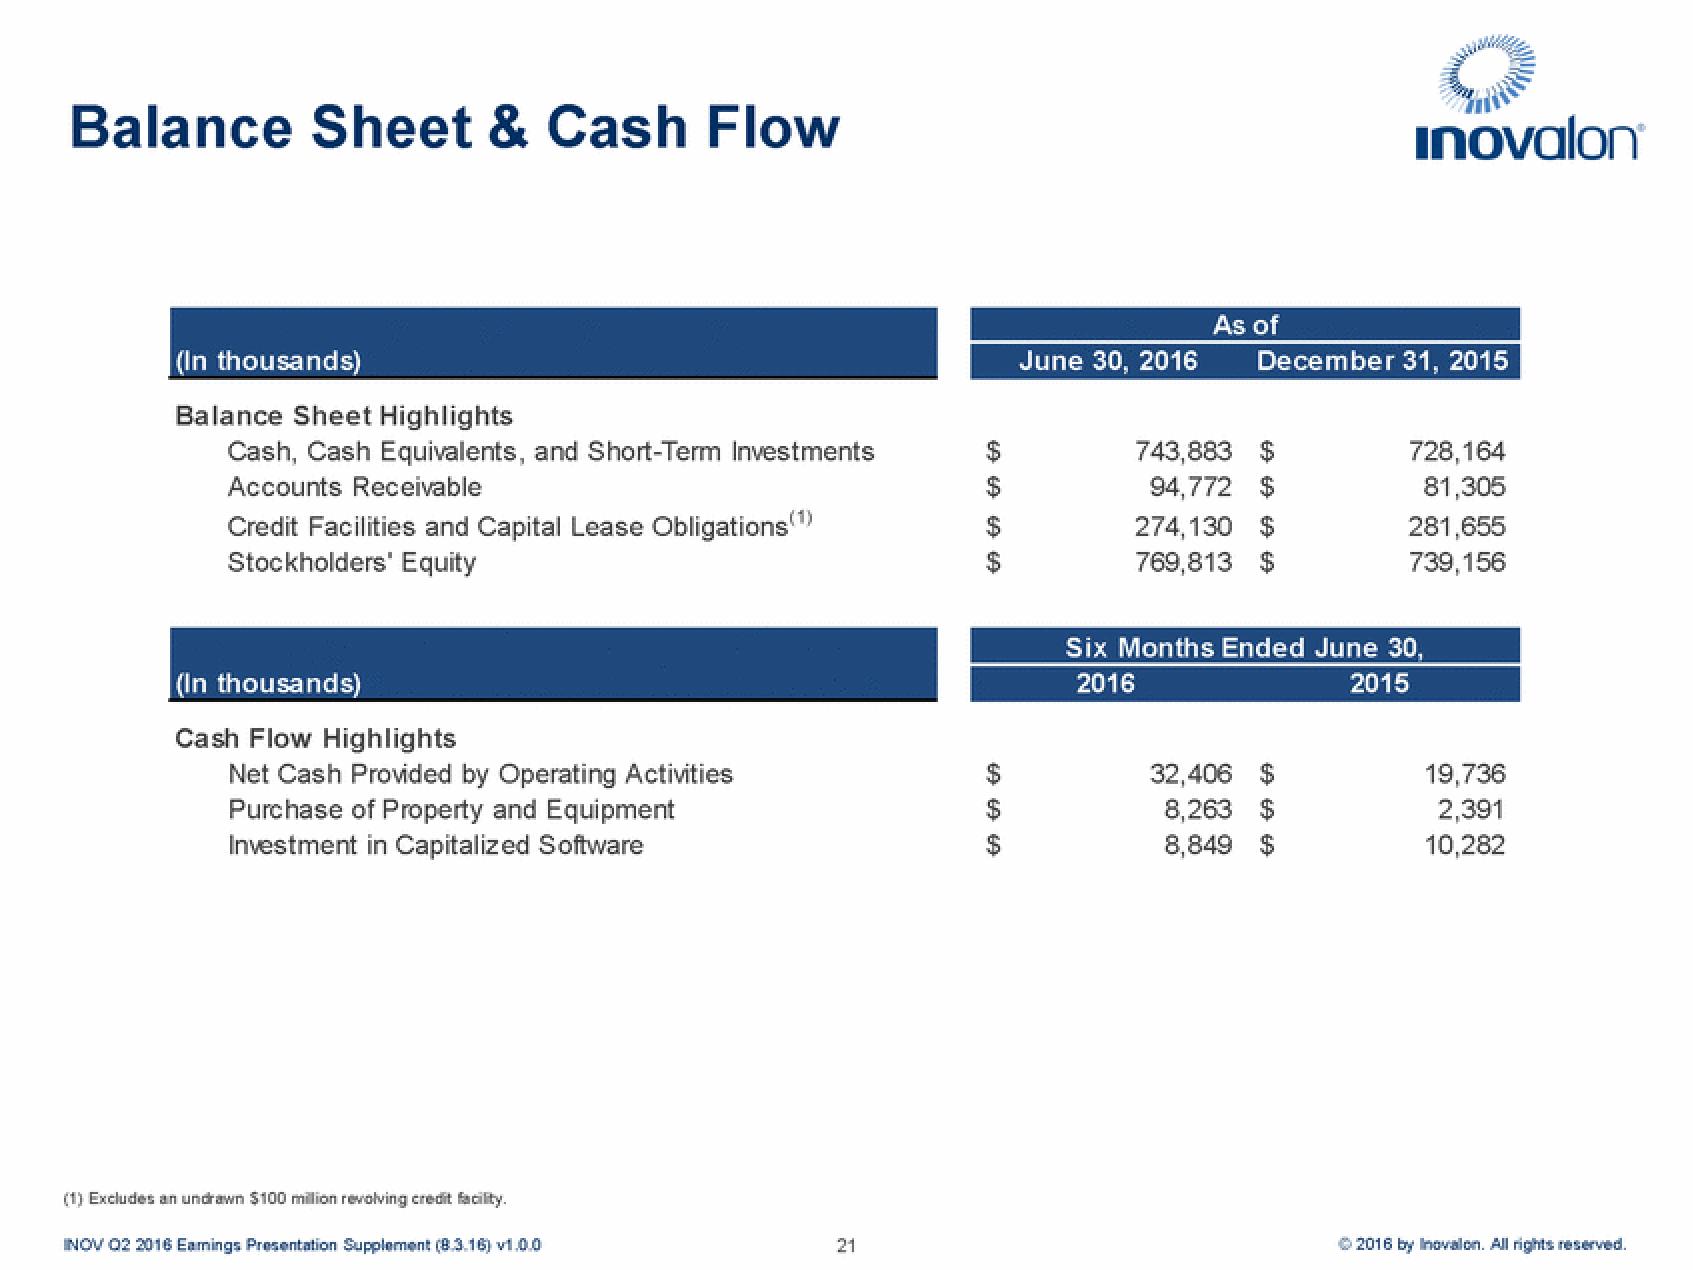
Balance Sheet & Cash Flow
(In thousands)
Balance Sheet Highlights
Cash, Cash Equivalents, and Short-Term Investments
Accounts Receivable
Credit Facilities and Capital Lease Obligations (1)
Stockholders' Equity
(In thousands)
Cash Flow Highlights
Net Cash Provided by Operating Activities
Purchase of Property and Equipment
Investment in Capitalized Software
(1) Excludes an undrawn $100 million revolving credit facility.
INOV 02 2016 Eamings Presentation Supplement (8.3.16) v1.0.0
21
69 69 69 69
69 69 69
As of
June 30, 2016 December 31, 2015
743,883 $
94,772 $
274,130 $
769,813 $
inovalon
32,406 $
8,263 $
8,849 $
728,164
81,305
281,655
739,156
Six Months Ended June 30,
2016
2015
19,736
2,391
10,282
© 2016 by Inovalon. All rights reserved.View entire presentation