Zegna Results Presentation Deck
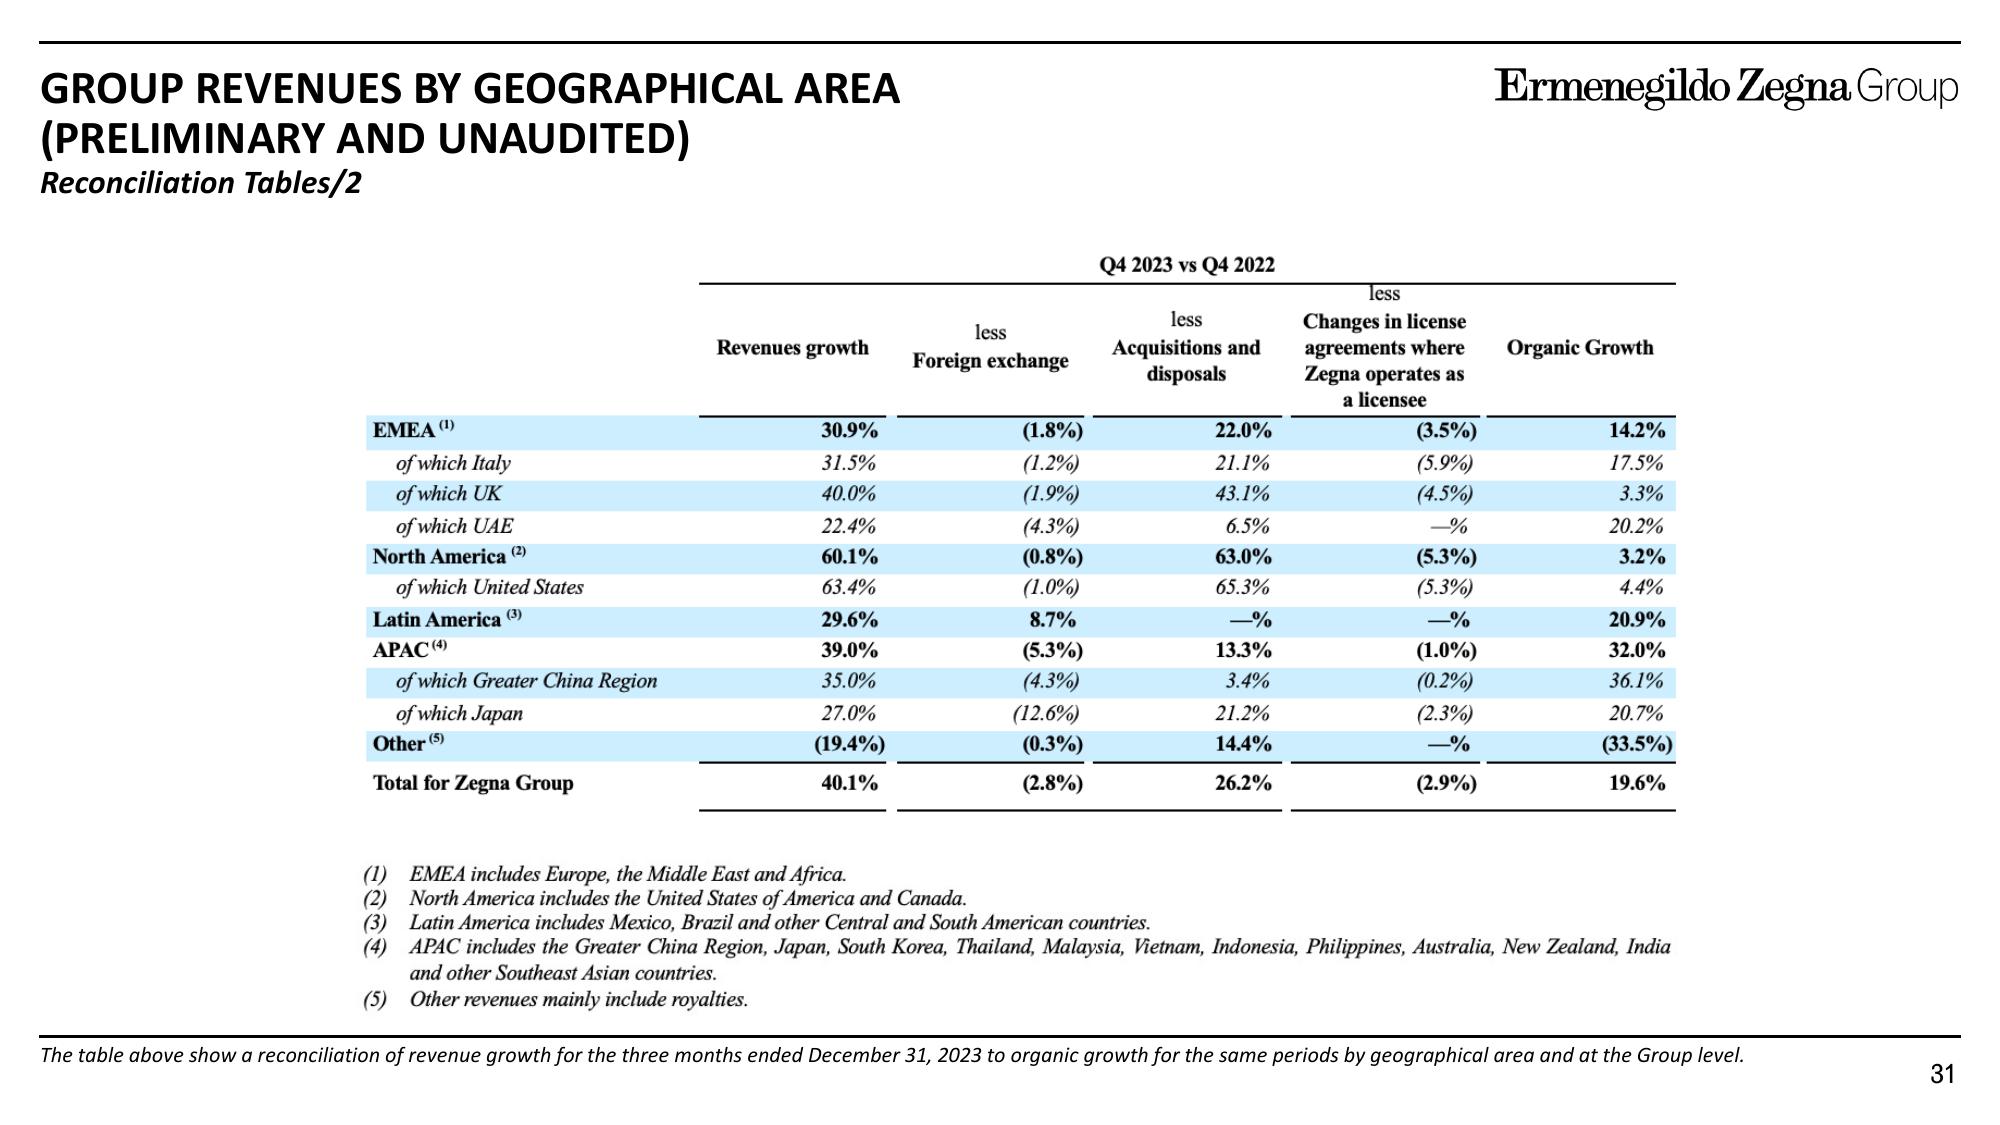
GROUP REVENUES BY GEOGRAPHICAL AREA
(PRELIMINARY AND UNAUDITED)
Reconciliation Tables/2
EMEA (0)
of which Italy
of which UK
of which UAE
North America (2)
of which United States
Latin America (3)
APAC (4)
of which Greater China Region
of which Japan
Other (5)
Total for Zegna Group
Revenues growth
30.9%
31.5%
40.0%
22.4%
60.1%
63.4%
29.6%
39.0%
35.0%
27.0%
(19.4%)
40.1%
less
Foreign exchange
(1.8%)
(1.2%)
(1.9%)
(4.3%)
(0.8%)
(1.0%)
8.7%
(5.3%)
(4.3%)
(12.6%)
(0.3%)
(2.8%)
Q4 2023 vs Q4 2022
less
Acquisitions and
disposals
22.0%
21.1%
43.1%
6.5%
63.0%
65.3%
-%
13.3%
3.4%
21.2%
14.4%
26.2%
less
Changes in license
agreements where
Zegna operates as
a licensee
(3.5%)
(5.9%)
(4.5%)
-%
(5.3%)
(5.3%)
-%
(1.0%)
(0.2%)
(2.3%)
-%
(2.9%)
Ermenegildo Zegna Group
Organic Growth
14.2%
17.5%
3.3%
20.2%
3.2%
4.4%
20.9%
32.0%
36.1%
20.7%
(33.5%)
19.6%
(1) EMEA includes Europe, the Middle East and Africa.
(2) North America includes the United States of America and Canada.
(3) Latin America includes Mexico, Brazil and other Central and South American countries.
(4) APAC includes the Greater China Region, Japan, South Korea, Thailand, Malaysia, Vietnam, Indonesia, Philippines, Australia, New Zealand, India
and other Southeast Asian countries.
(5)
Other revenues mainly include royalties.
The table above show a reconciliation of revenue growth for the three months ended December 31, 2023 to organic growth for the same periods by geographical area and at the Group level.
31View entire presentation