WeWork Investor Presentation Deck
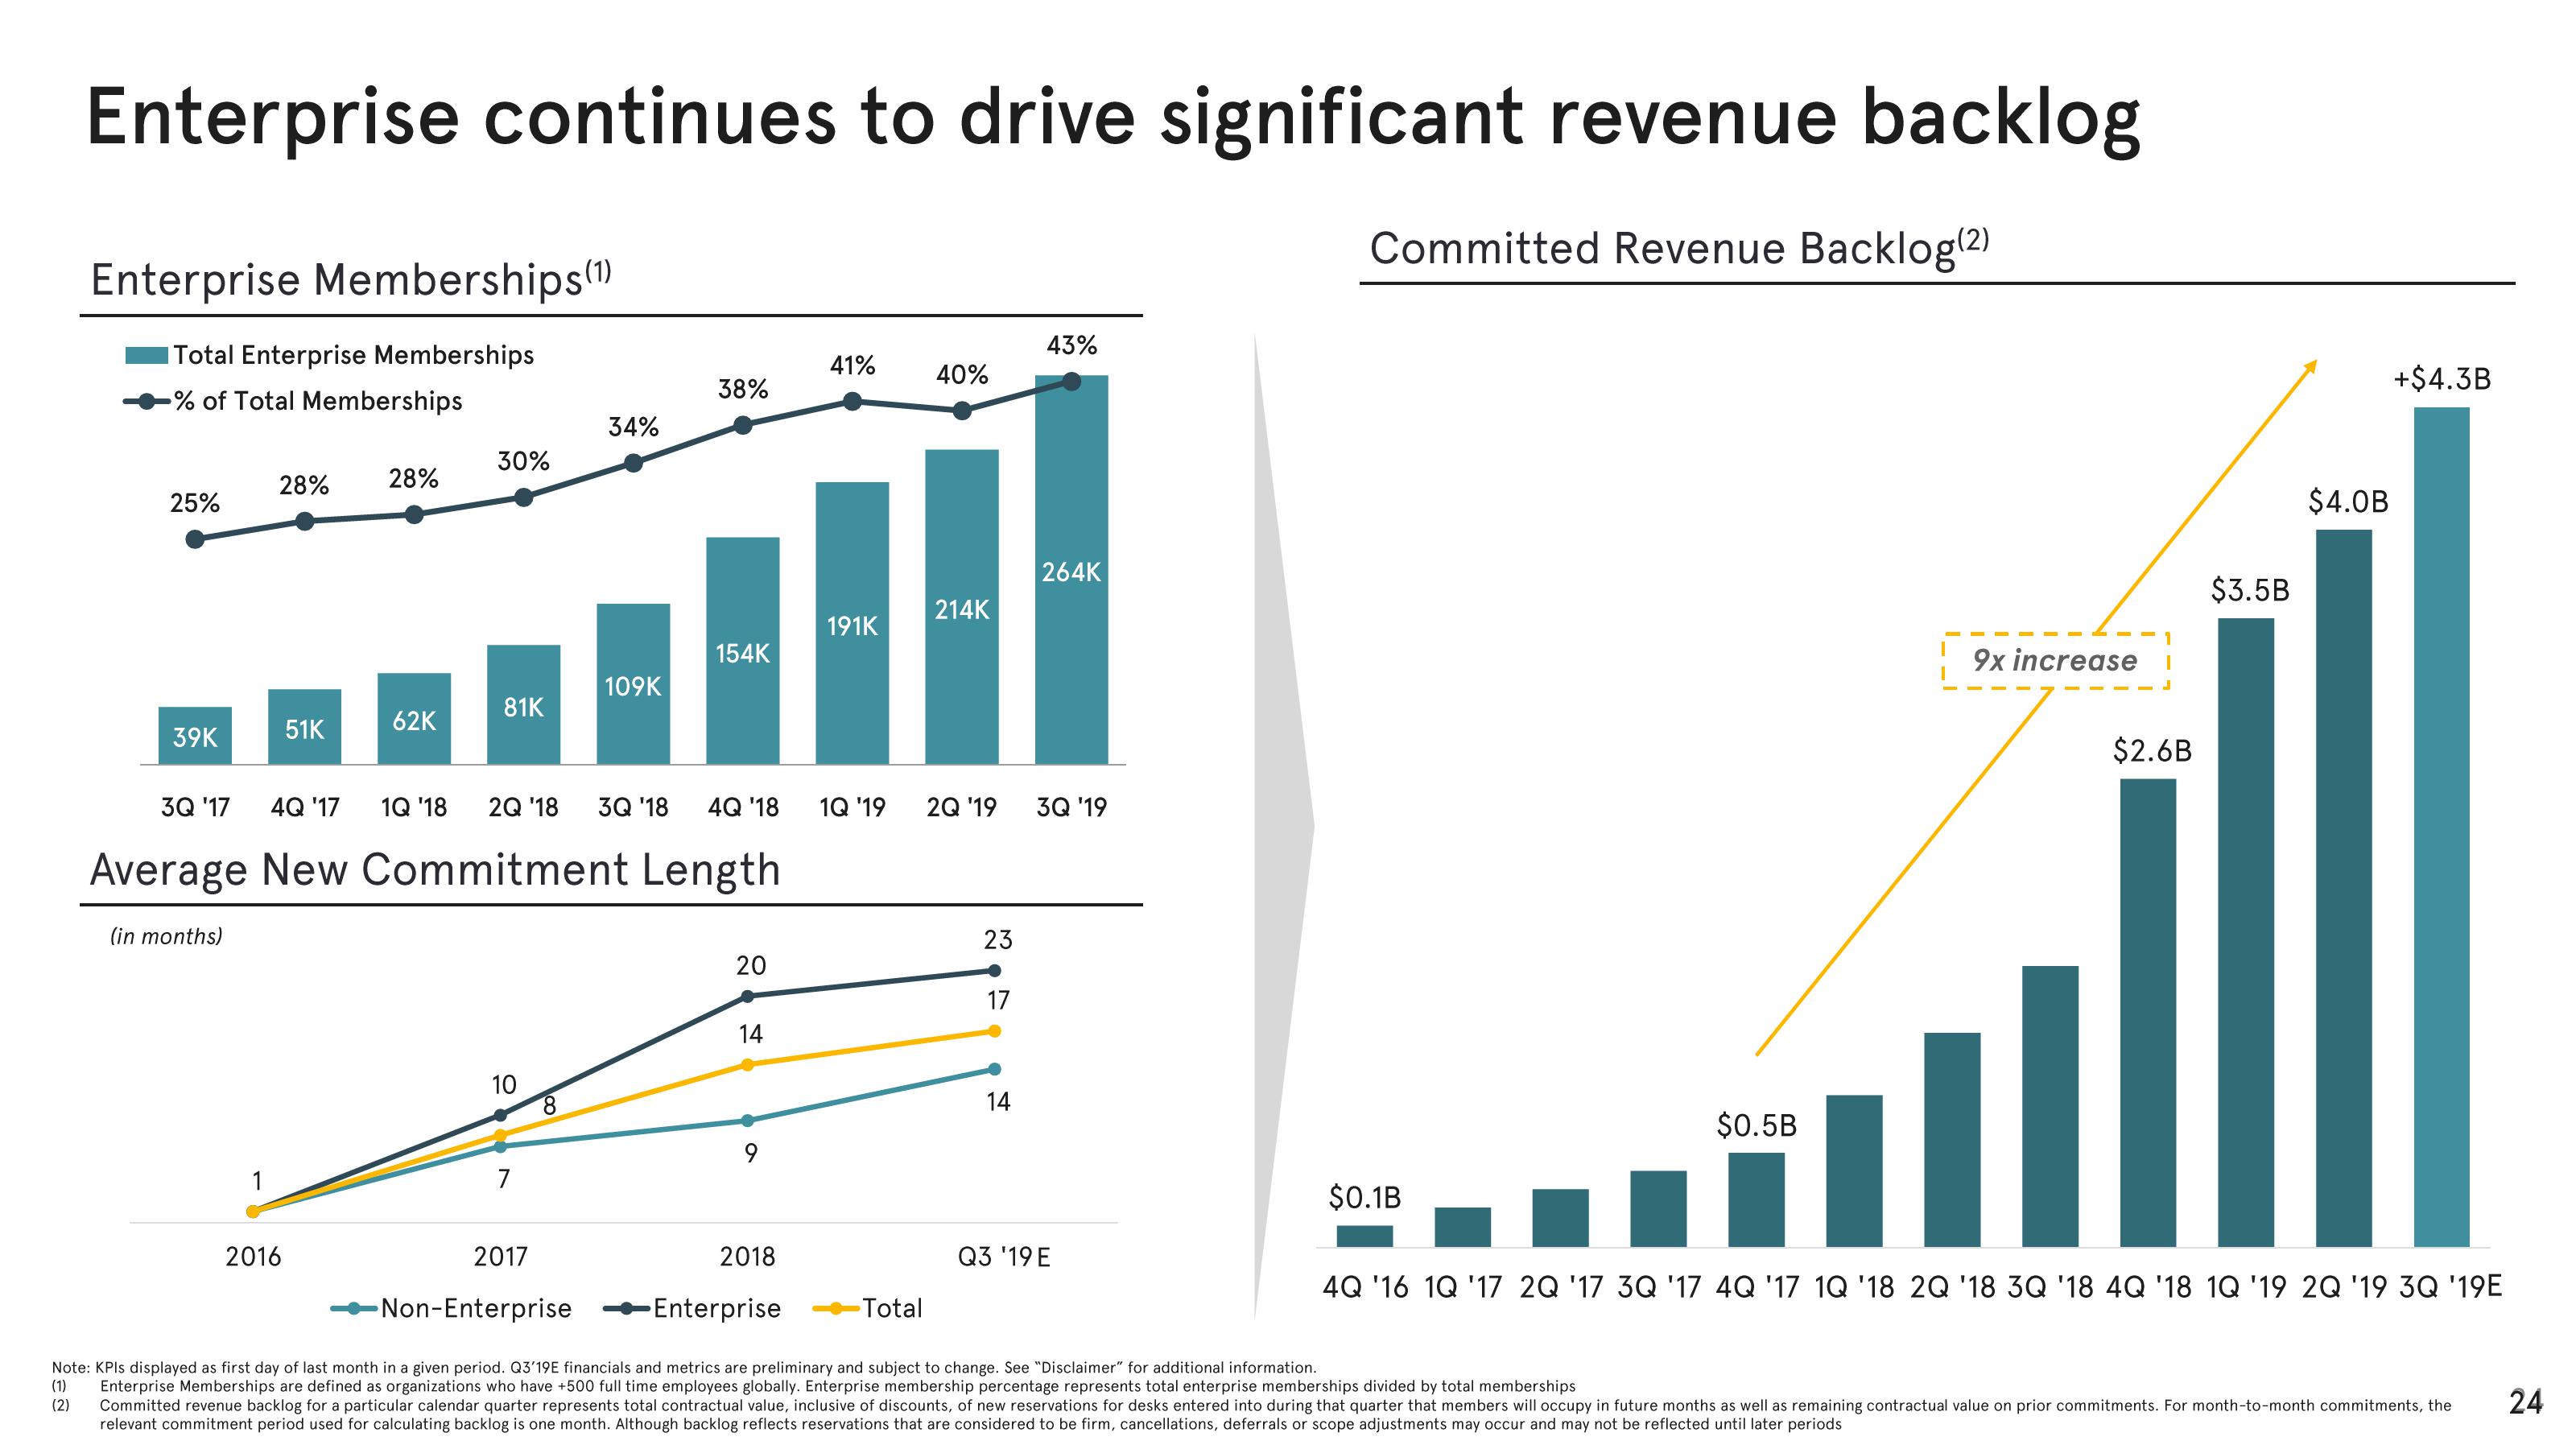
Enterprise continues to drive significant revenue backlog
Committed Revenue Backlog(2)
Enterprise Memberships (¹)
Total Enterprise Memberships
-% of Total Memberships
25%
39K
(in months)
28%
1
51K
28%
2016
62K
30%
81K
3Q '17 4Q '17 1Q '18 2Q '18 3Q '18 4Q '18
Average New Commitment Length
10
7
34%
∞
109K
38%
154K
20
14
9
41%
2018
191K
40%
214K
1Q '19 2Q '19
-Total
23
17
14
43%
264K
3Q '19
$0.1B
Q3 '19 E
$0.5B
9x increase
J
$2.6B
2017
Non-Enterprise
Enterprise
Note: KPIs displayed as first day of last month in a given period. Q3'19E financials and metrics are preliminary and subject to change. See "Disclaimer" for additional rma
(1) Enterprise Memberships are defined as organizations who have +500 full time employees globally. Enterprise membership percentage represents total enterprise memberships divided by total memberships.
Committed revenue backlog for a particular calendar quarter represents total contractual value, inclusive of discounts, of new reservations for desks entered into during that quarter that members will occupy in future months as well as remaining contractual value on prior commitments. For month-to-month commitments, the
relevant commitment period used for calculating backlog is one month. Although backlog reflects reservations that are considered to be firm, cancellations, deferrals or scope adjustments may occur and may not be reflected until later periods
(2)
$3.5B
$4.0B
+$4.3B
4Q '16 1Q '17 2Q '17 3Q '17 4Q '17 1Q '18 2Q '18 3Q '18 4Q '18 1Q '19 2Q '19 3Q '19E
24View entire presentation