DCC Results Presentation Deck
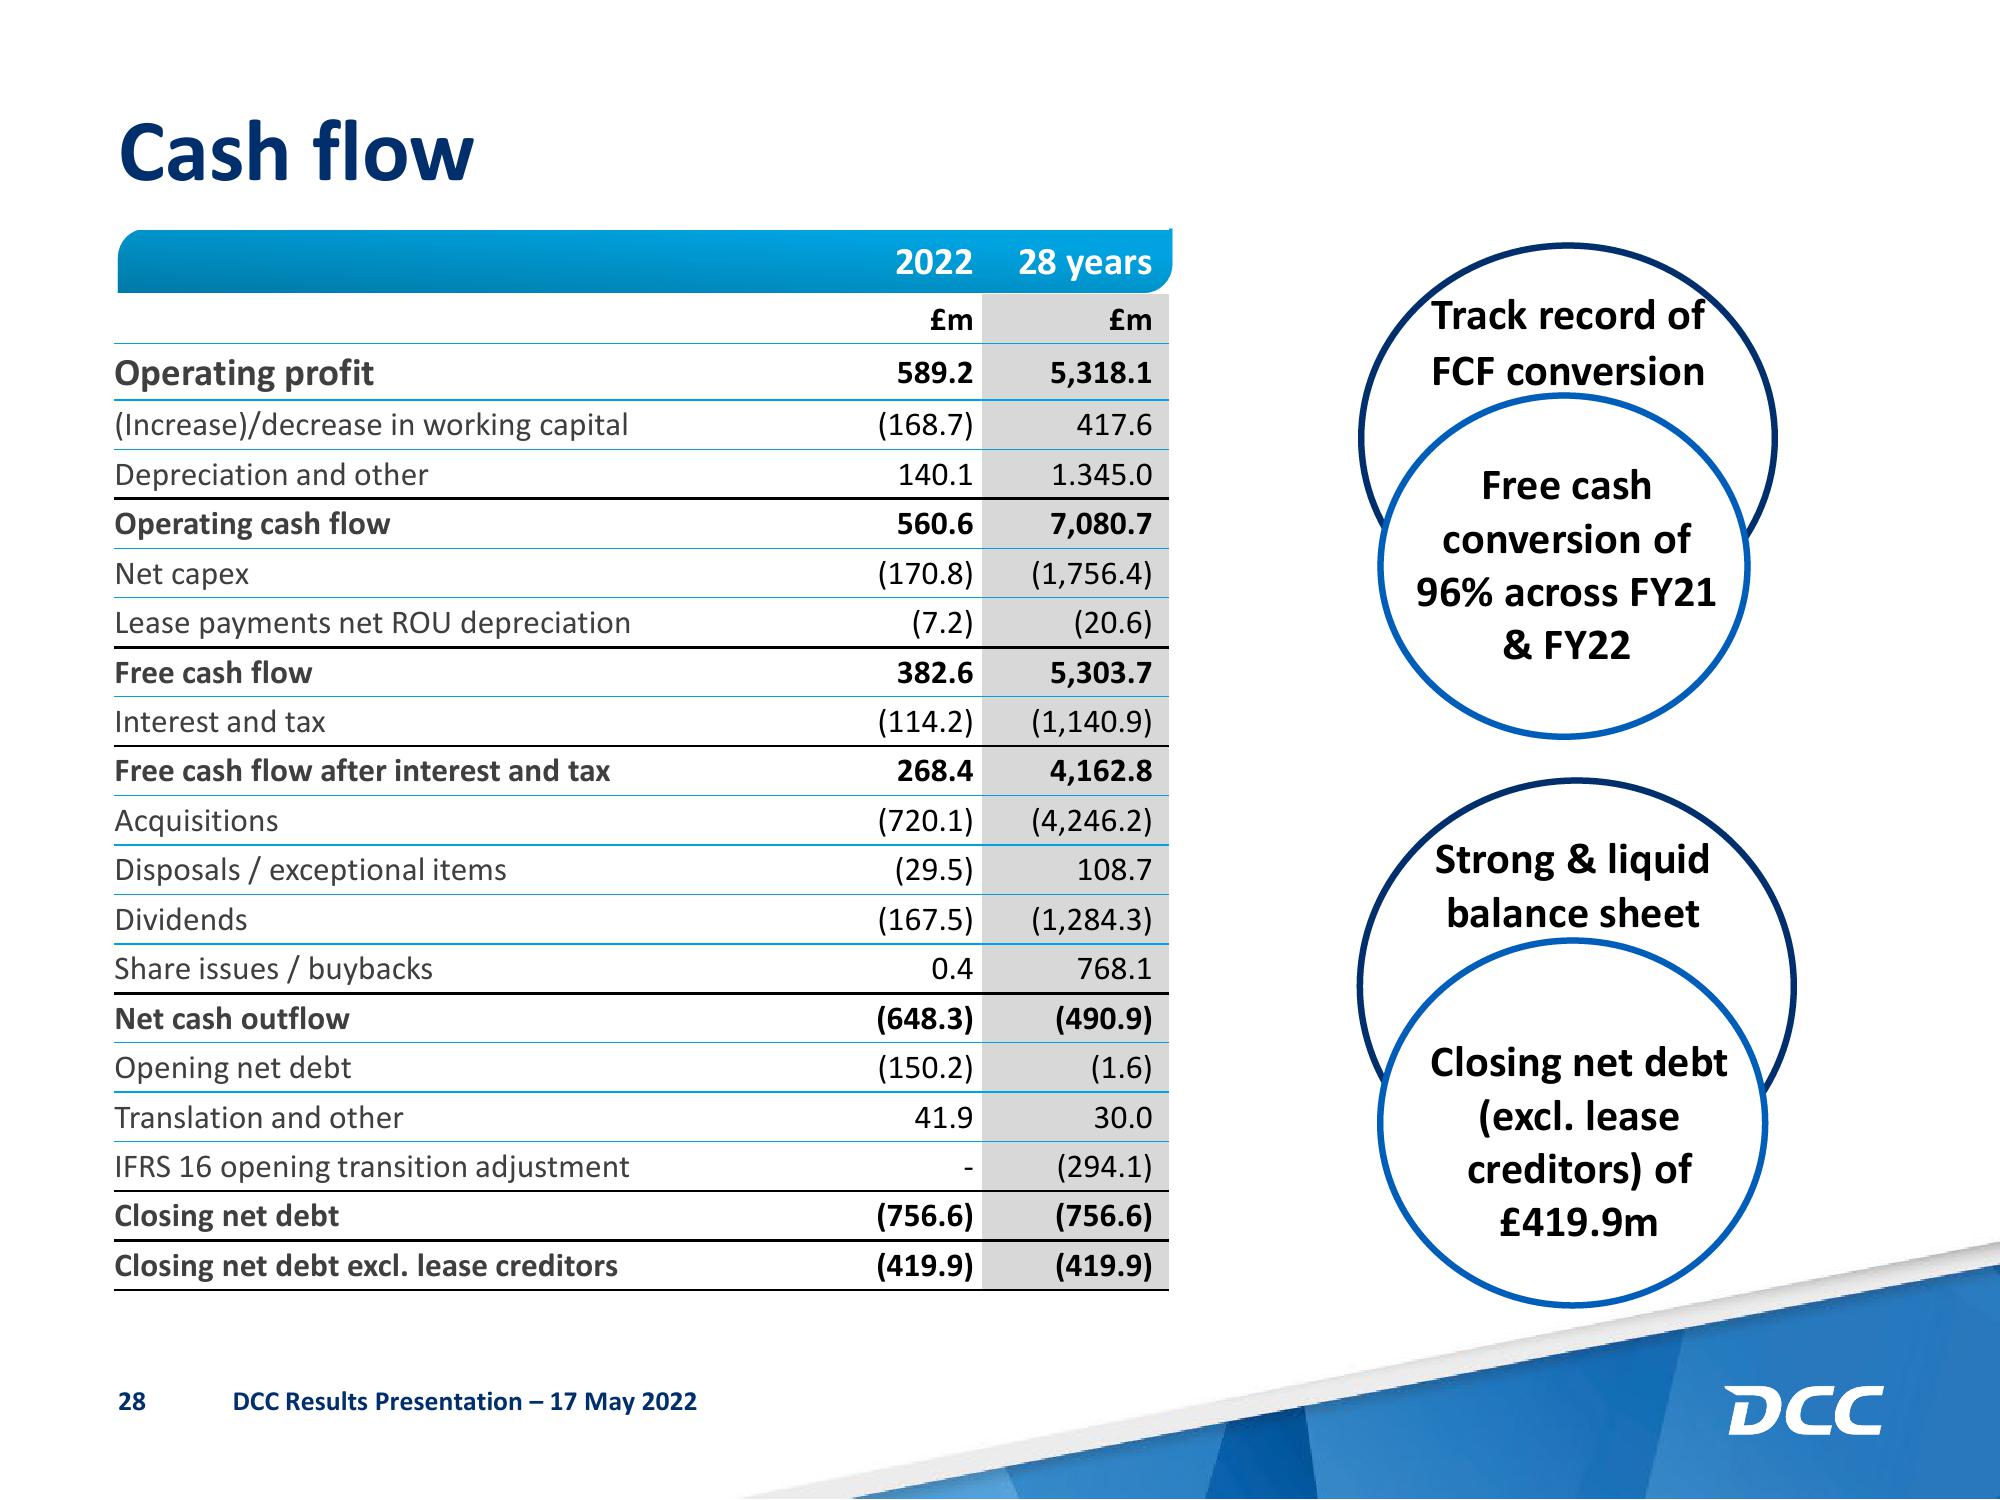
Cash flow
Operating profit
(Increase)/decrease in working capital
Depreciation and other
Operating cash flow
Net capex
Lease payments net ROU depreciation
Free cash flow
Interest and tax
Free cash flow after interest and tax
Acquisitions
Disposals / exceptional items
Dividends
Share issues / buybacks
Net cash outflow
Opening net debt
Translation and other
IFRS 16 opening transition adjustment
Closing net debt
Closing net debt excl. lease creditors
28
DCC Results Presentation - 17 May 2022
2022
£m
589.2
(168.7)
140.1
560.6
(170.8)
(7.2)
382.6
(114.2)
268.4
(720.1)
(29.5)
(167.5)
0.4
(648.3)
(150.2)
41.9
(756.6)
(419.9)
28 years
£m
5,318.1
417.6
1.345.0
7,080.7
(1,756.4)
(20.6)
5,303.7
(1,140.9)
4,162.8
(4,246.2)
108.7
(1,284.3)
768.1
(490.9)
(1.6)
30.0
(294.1)
(756.6)
(419.9)
Track record of
FCF conversion
Free cash
conversion of
96% across FY21
& FY22
Strong & liquid
balance sheet
Closing net debt
(excl. lease
creditors) of
£419.9m
DCCView entire presentation