Sezzle Results Presentation Deck
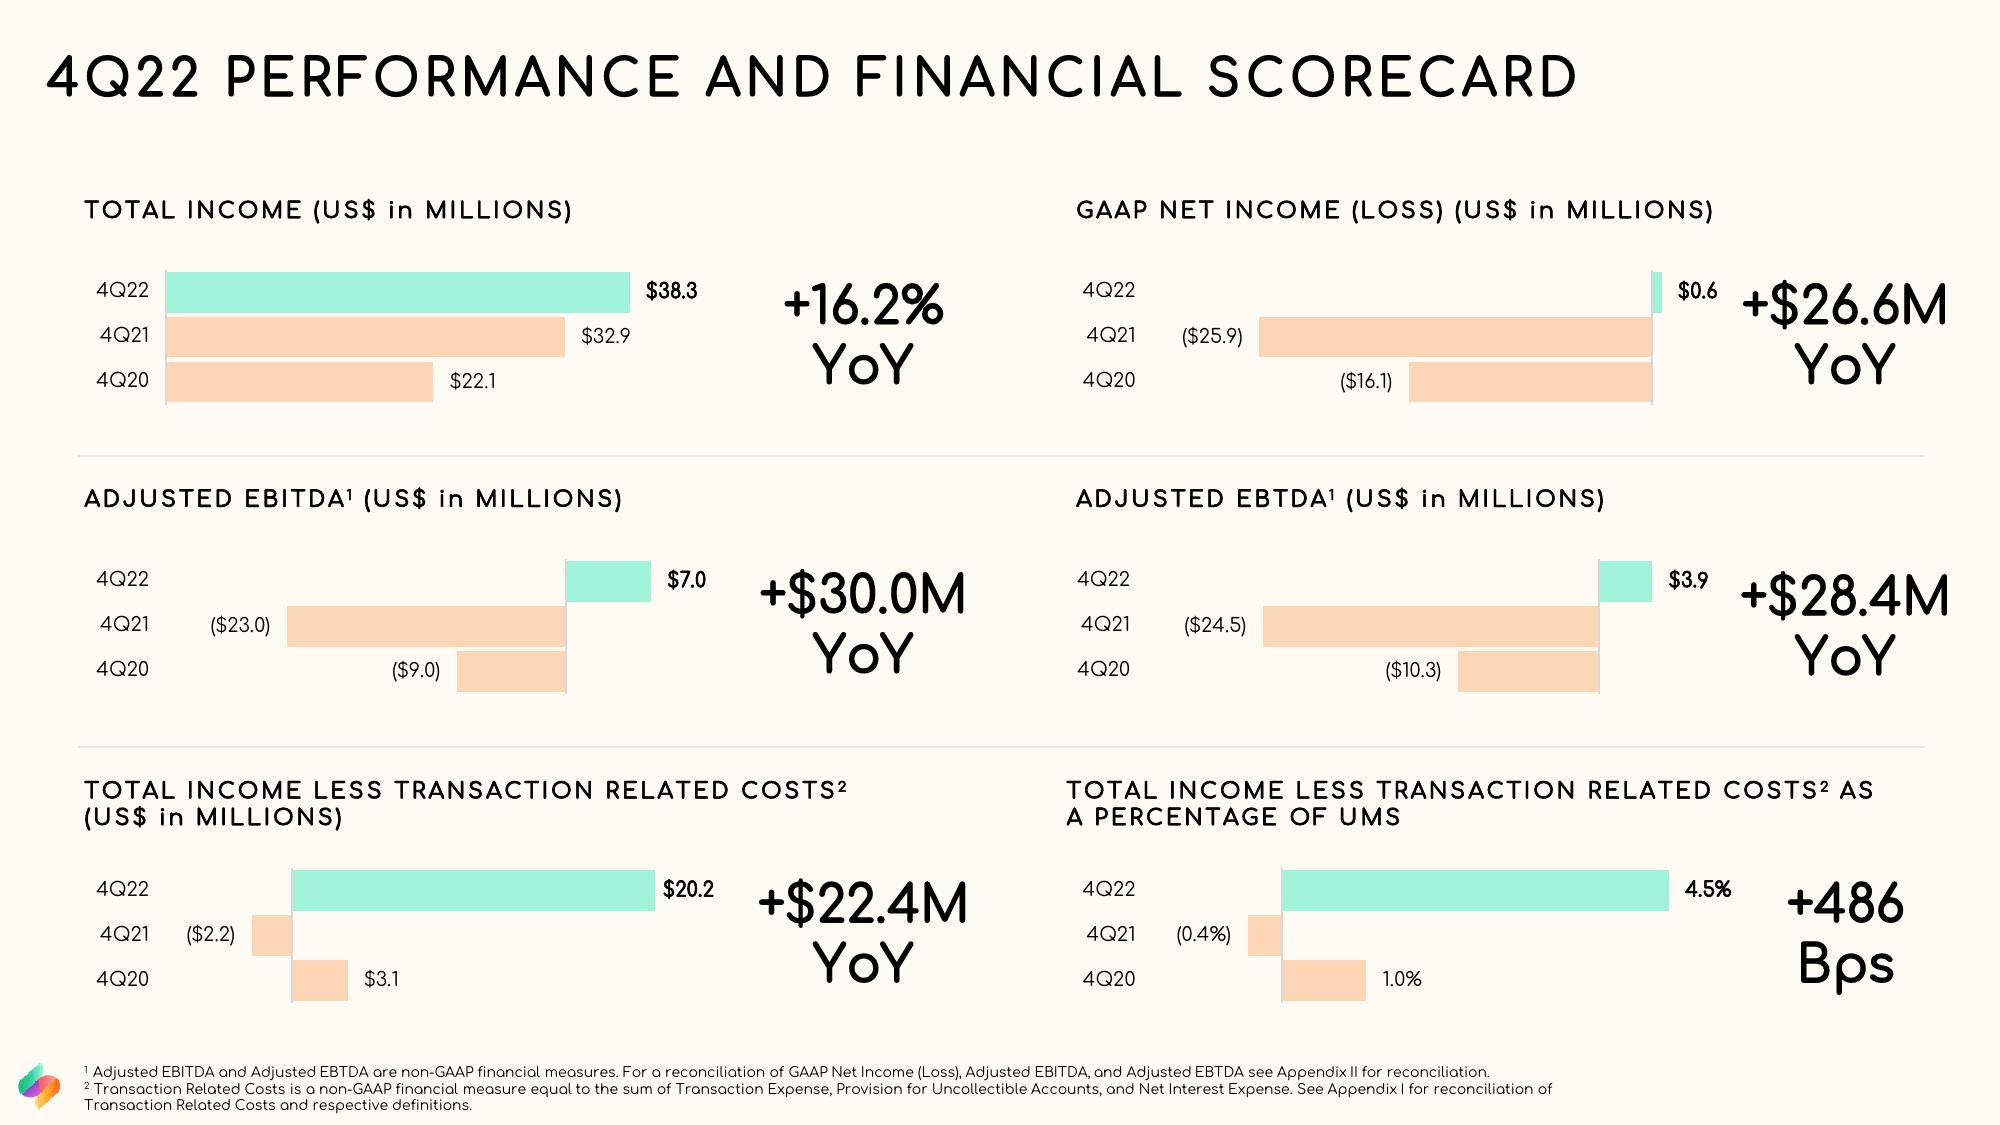
4Q22 PERFORMANCE AND FINANCIAL SCORECARD
TOTAL INCOME (US$ in MILLIONS)
4Q22
4Q21
4Q20
4Q22
ADJUSTED EBITDA¹ (US$ in MILLIONS)
4Q21
4Q20
4Q22
($23.0)
4Q21
4Q20
($9.0)
($2.2)
$22.1
$32.9
$3.1
$38.3
TOTAL INCOME LESS TRANSACTION RELATED COSTS²
(US$ in MILLIONS)
$7.0
+16.2%
YoY
$20.2
+$30.0M
YoY
+$22.4M
YoY
GAAP NET INCOME (LOSS) (US$ in MILLIONS)
4Q22
4Q21 ($25.9)
4Q20
ADJUSTED EBTDA¹ (US$ in MILLIONS)
4Q22
4Q21 ($24.5)
4Q20
($16.1)
4Q22
4Q21 (0.4%)
4Q20
($10.3)
TOTAL INCOME LESS TRANSACTION RELATED COSTS² AS
A PERCENTAGE OF UMS
1.0%
$0.6 +$26.6M
YoY
1 Adjusted EBITDA and Adjusted EBTDA are non-GAAP financial measures. For a reconciliation of GAAP Net Income (Loss), Adjusted EBITDA, and Adjusted EBTDA see Appendix II for reconciliation.
2 Transaction Related Costs is a non-GAAP financial measure equal to the sum of Transaction Expense, Provision for Uncollectible Accounts, and Net Interest Expense. See Appendix I for reconciliation of
Transaction Related Costs and respective definitions.
$3.9
+$28.4M
YoY
4.5%
+486
BpsView entire presentation