Evercore Investment Banking Pitch Book
Appendix
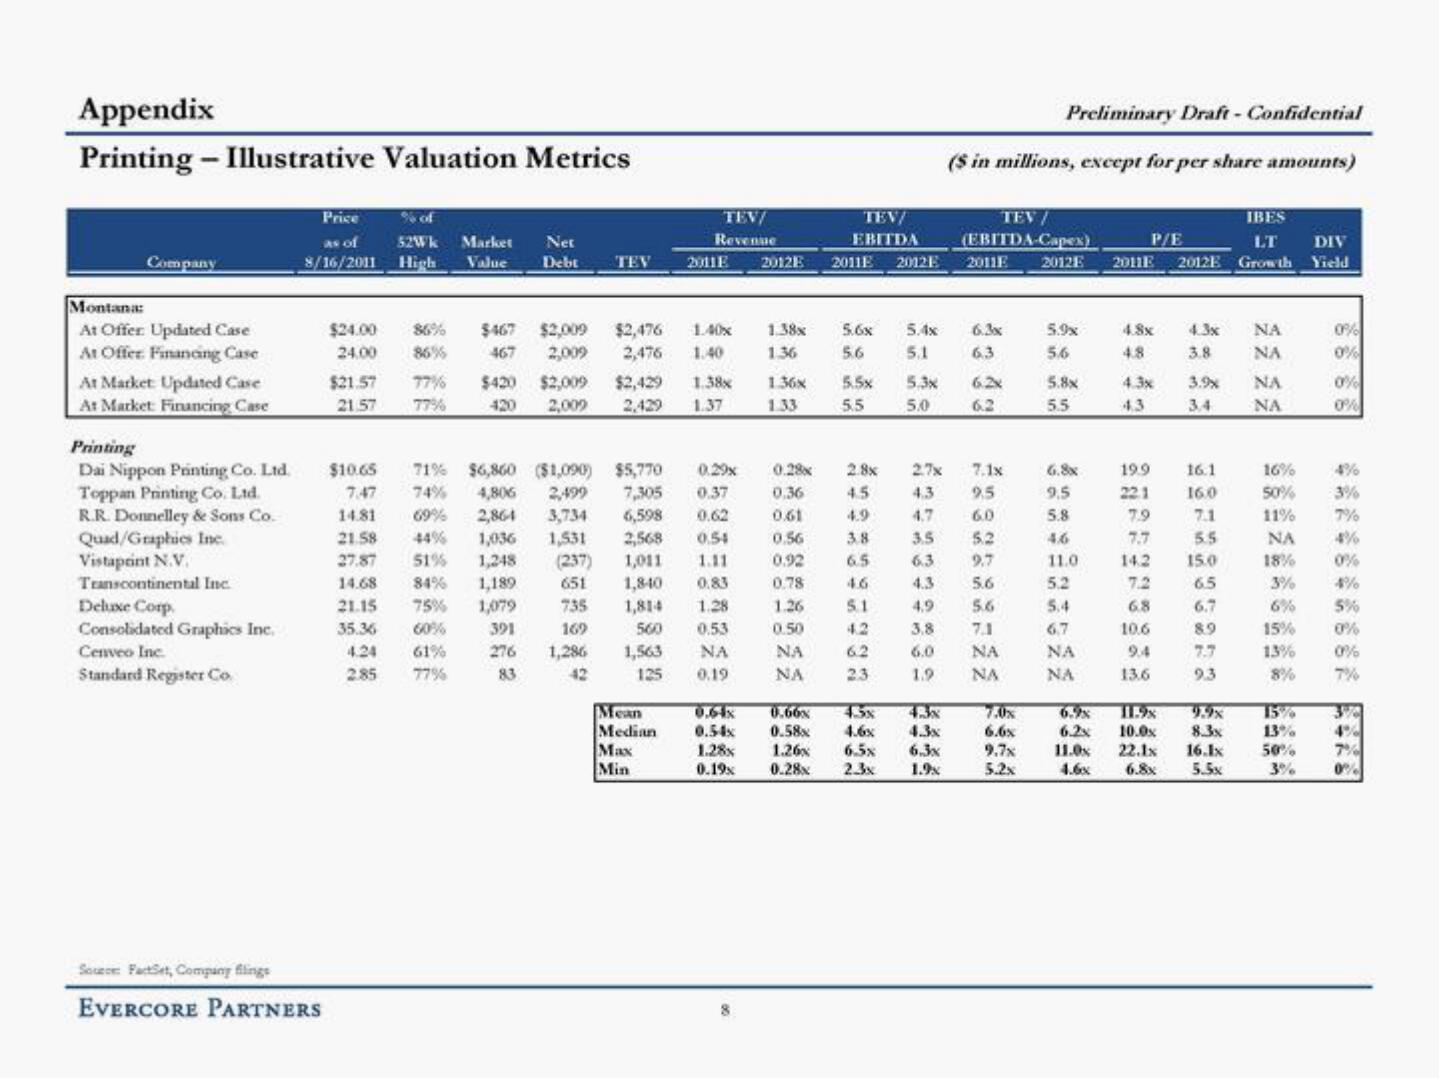
Printing - Illustrative Valuation Metrics
Company
Montana:
At Offer: Updated Case
At Offer Financing Case
At Market Updated Case
At Market Financing Case
Printing
Dai Nippon Printing Co. Ltd.
Toppan Printing Co. Ltd.
R.R. Donnelley & Sons Co.
Quad/Graphics Inc.
Vistaprint N.V.
Transcontinental Inc.
Deluxe Corp.
Consolidated Graphics Inc.
Cenveo Inc.
Standard Register Co.
Price
as of
8/16/2011
Source FactSet, Company filings
EVERCORE PARTNERS
52Wk Market Net
High Value
Debt
$24.00
24.00
$21.57
21.57 77%
$10.65
7.47
14.81
86% $467
86%
35.36
4.24
2.85
$2,009
467 2,009
77% $420 $2,009
2,009
TEV
$2,476
2,476
TEV/
Revenue
2011E
Mean
Median
Max
Min
1.40x
1.40
$2,429
2,429 1.37
71% $6,860 ($1,090)
$5,770
0.29x
74%
4,806
0.37
2,499
7,305
3,734 6,598 0.62
69% 2,864
21.58 44% 1,036 1,531 2,568 0.54
27.87 51% 1,248 (237) 1,011 1.11
651 1,840 0.83
14.68
84% 1,189
21.15
75%
1,079
735 1,814 1.28
60%
391
0.53
169
560
276 1,286 1,563
61%
NA
77%
83
42
125
0.19
1.38x 1.36x
1.33
2012E 2011E 2012 E
1.38x
1.36
TEV/
EBITDA
0.28x
0.36
0.61
0.56
0.92
0.78
1.26
0.50
NA
NA
5.6x
5.6
5.5x
5.5
5.4x
5.1
2.8x 2.7x
4.5
4.9
3.8
6.5
46
5.1
4.2
62
23
Preliminary Draft - Confidential
($ in millions, except for per share amounts)
TEV /
(EBITDA-Capex)
4.3x
0.64x 0.66% 458 488
0.54x 0.58x 4.6x
1.28x 1.26% 6.5x
0.19x 0.28% 2.3x
6.3x
1.9%
2011E
5.3x 6.2x
5.0
6.2
6.3x
63
7.1x
4.3 9.5
6.0
3.5
52
6.3 9,7
4.3
5.6
4.9
5.6
3.8 7.1
6.0
NA
1.9 NA
7.0%
6.6x
9.7x
5.2x
2012E
5.9x
56
5.8x
5.5
6.8x
9.5
5.8
46
11.0
5.2
5.4
6.7
NA
NA
IBES
LT
2011E 2012E Growth
P/E
4.8x
4.8
4.3x
43
19.9
221
7.9
142
7.2
6.8
10.6
9.4
13.6
6.9%
6.2x 10.0x
4.3x ΝΑ
3.8
NA
3.4
16.1
16.0
7.1
5.5
15.0
6.5
6.7
8.9
9.3
8.3x
11.0x 22.1x 16.1x
4.6x
6.8x
5.5x
NA
NA
16%
50%
11%
NA
18%
3%
6%
15%
13%
8%
15%
13%
50%
3%
DIV
Yield
0%
0%
0%
0%
3%
7%
0%
4%
5%
0%
0%
7%
90
4%
7%
0%View entire presentation