Etsy Mergers and Acquisitions Presentation Deck slide image

Etsy Mergers and Acquisitions Presentation Deck

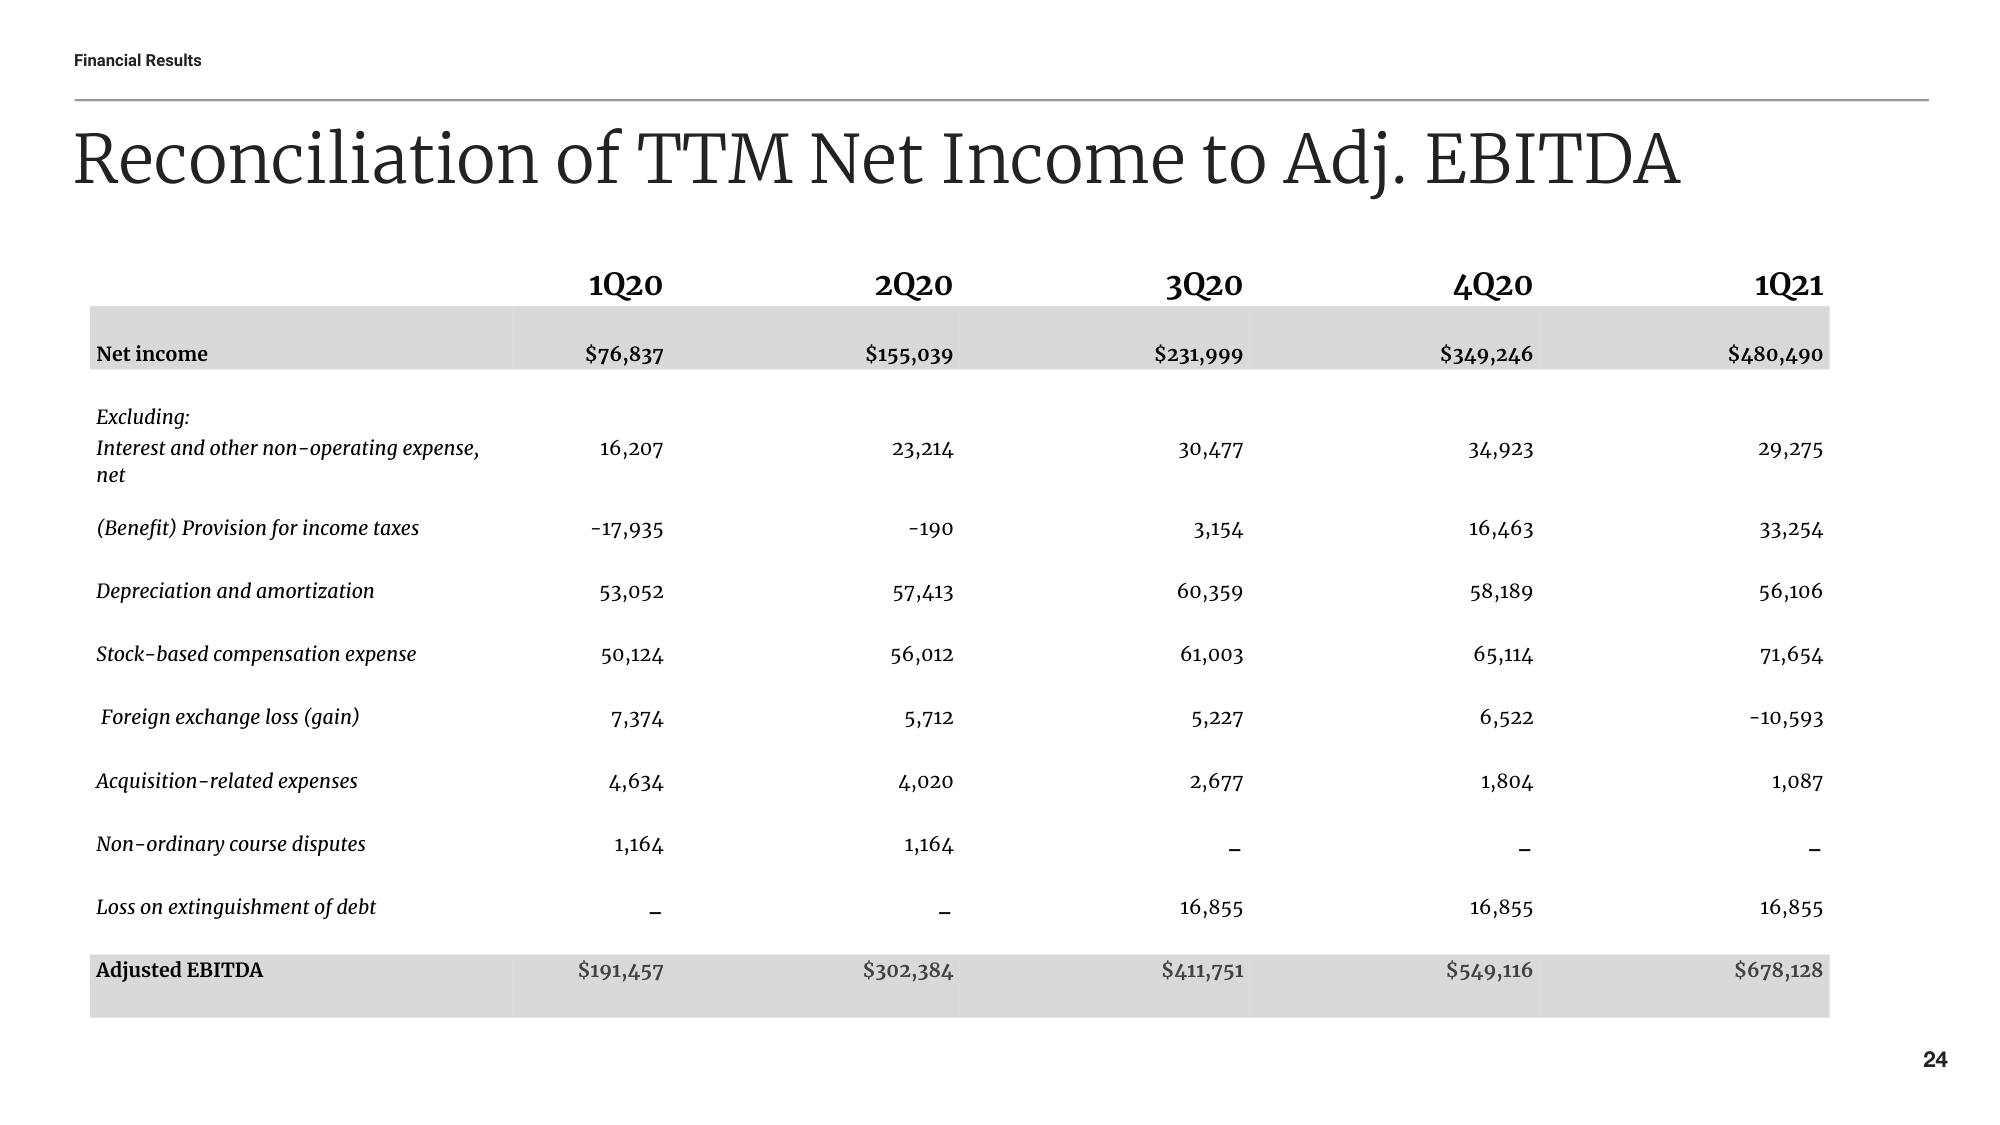
Financial Results Reconciliation of TTM Net Income to Adj. EBITDA Net income Excluding: Interest and other non-operating expense, net (Benefit) Provision for income taxes Depreciation and amortization Stock-based compensation expense Foreign exchange loss (gain) Acquisition-related expenses Non-ordinary course disputes Loss on extinguishment of debt Adjusted EBITDA 1020 $76,837 16,207 -17,935 53,052 50,124 7,374 4,634 1,164 $191,457 2Q20 $155,039 23,214 -190 57,413 56,012 5,712 4,020 1,164 $302,384 3Q20 $231,999 30,477 3,154 60,359 61,003 5,227 2,677 16,855 $411,751 4Q20 $349,246 34,923 16,463 58,189 65,114 6,522 1,804 16,855 $549,116 1Q21 $480,490 29,275 33,254 56,106 71,654 -10,593 1,087 16,855 $678,128 24
View entire presentation