First Busey Results Presentation Deck
2Q23 Earnings Investor Presentation
Net Interest Margin
Net Interest Income Trend ¹
$ in millions
$76.5
$0.6
$0.6
$75.3
2022 Q2
$86.8
$0.8
+3.13%
$85.9
2022 Q3
Net Interest Income
1023 NIM
1
$91.7
$0.5
$91.2
2022 Q4
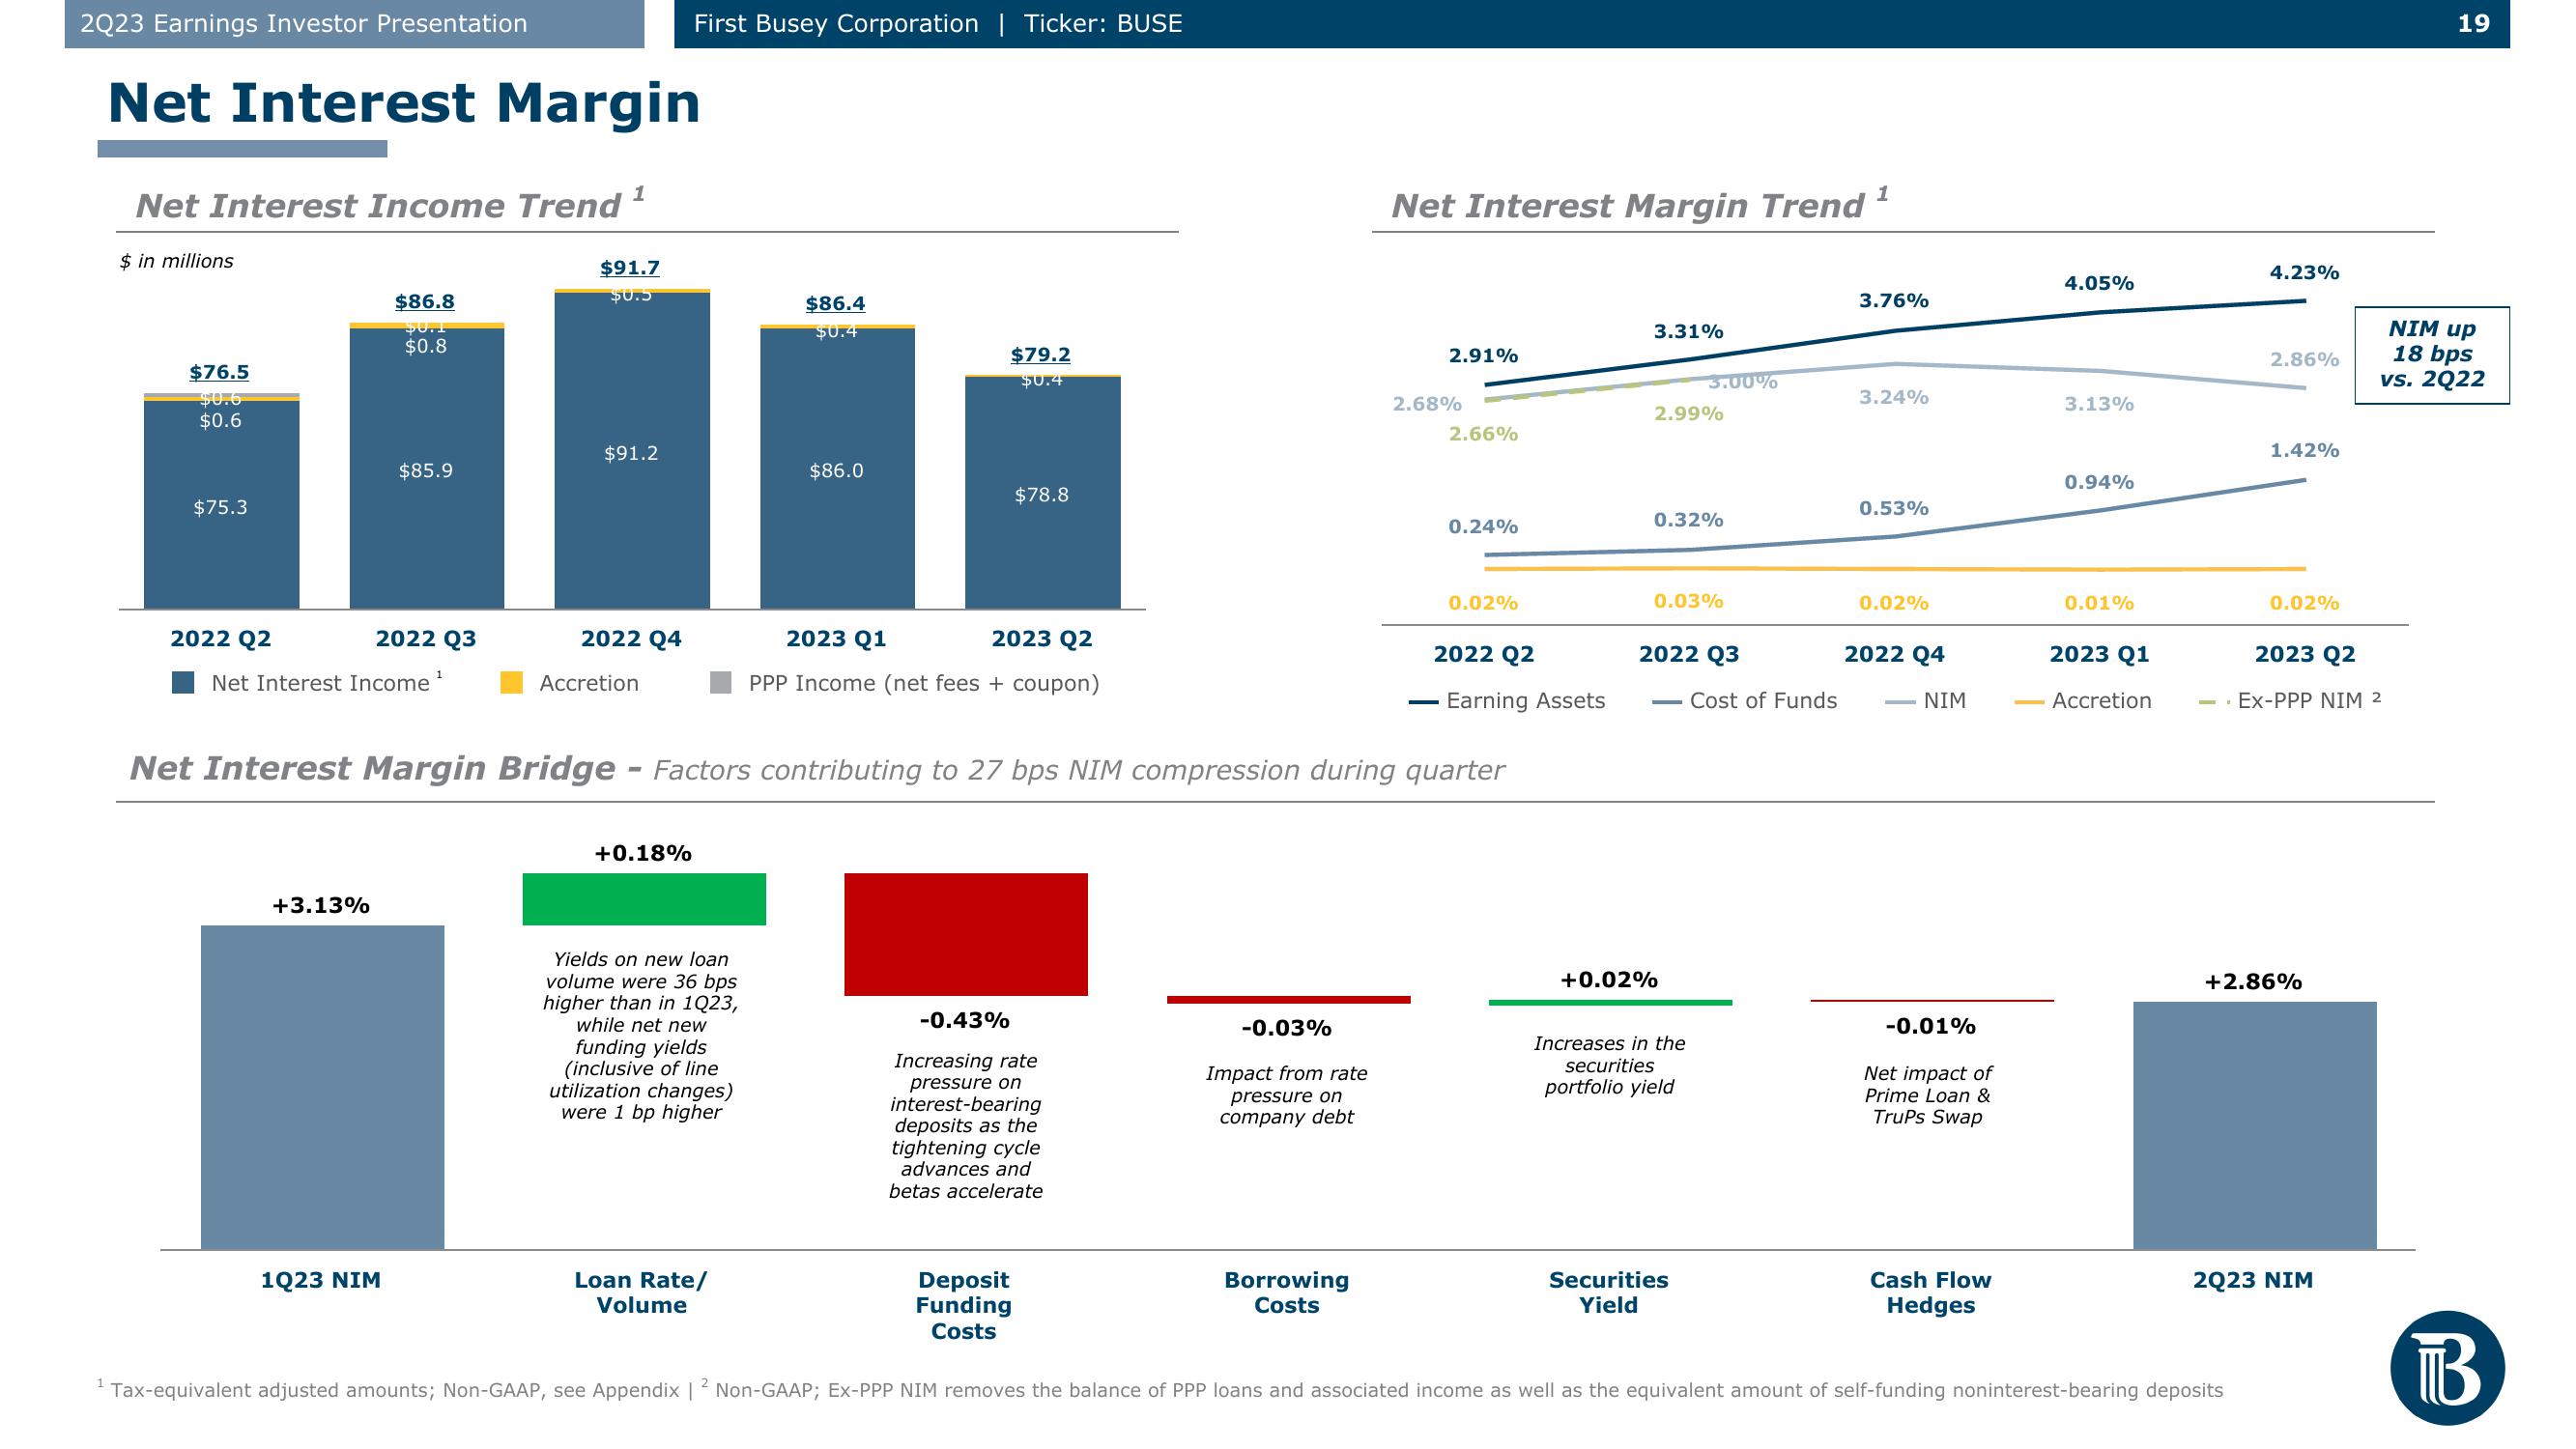
Net Interest Margin Bridge
Accretion
First Busey Corporation | Ticker: BUSE
+0.18%
Yields on new loan
volume were 36 bps
higher than in 1Q23,
while net new
funding yields
(inclusive of line
utilization changes)
were 1 bp higher
$86.4
$0.4
$86.0
Loan Rate/
Volume
$79.2
$0.4
$78.8
2023 Q1
2023 Q2
PPP Income (net fees + coupon)
-0.43%
Increasing rate
pressure on
interest-bearing
deposits as the
tightening cycle
advances and
betas accelerate
-0.03%
Impact from rate
pressure on
company debt
Net Interest Margin Trend
Factors contributing to 27 bps NIM compression during quarter
2.91%
Borrowing
Costs
2.68%
2.66%
0.24%
0.02%
2022 Q2
Earning Assets
3.31%
+0.02%
2.99%
3.00%
0.32%
0.03%
2022 Q3
Increases in the
securities
portfolio yield
Securities
Yield
Cost of Funds
1
3.76%
3.24%
0.53%
0.02%
2022 Q4
NIM
-0.01%
Net impact of
Prime Loan &
Trups Swap
4.05%
Cash Flow
Hedges
3.13%
0.94%
Deposit
Funding
Costs
Tax-equivalent adjusted amounts; Non-GAAP, see Appendix | 2 Non-GAAP; EX-PPP NIM removes the balance of PPP loans and associated income as well as the equivalent amount of self-funding noninterest-bearing deposits
0.01%
2023 Q1
Accretion
4.23%
2.86%
1.42%
0.02%
+2.86%
2023 Q2
Ex-PPP NIM 2
2023 NIM
19
NIM up
18 bps
vs. 2Q22
ТВView entire presentation