Allwyn Investor Presentation Deck
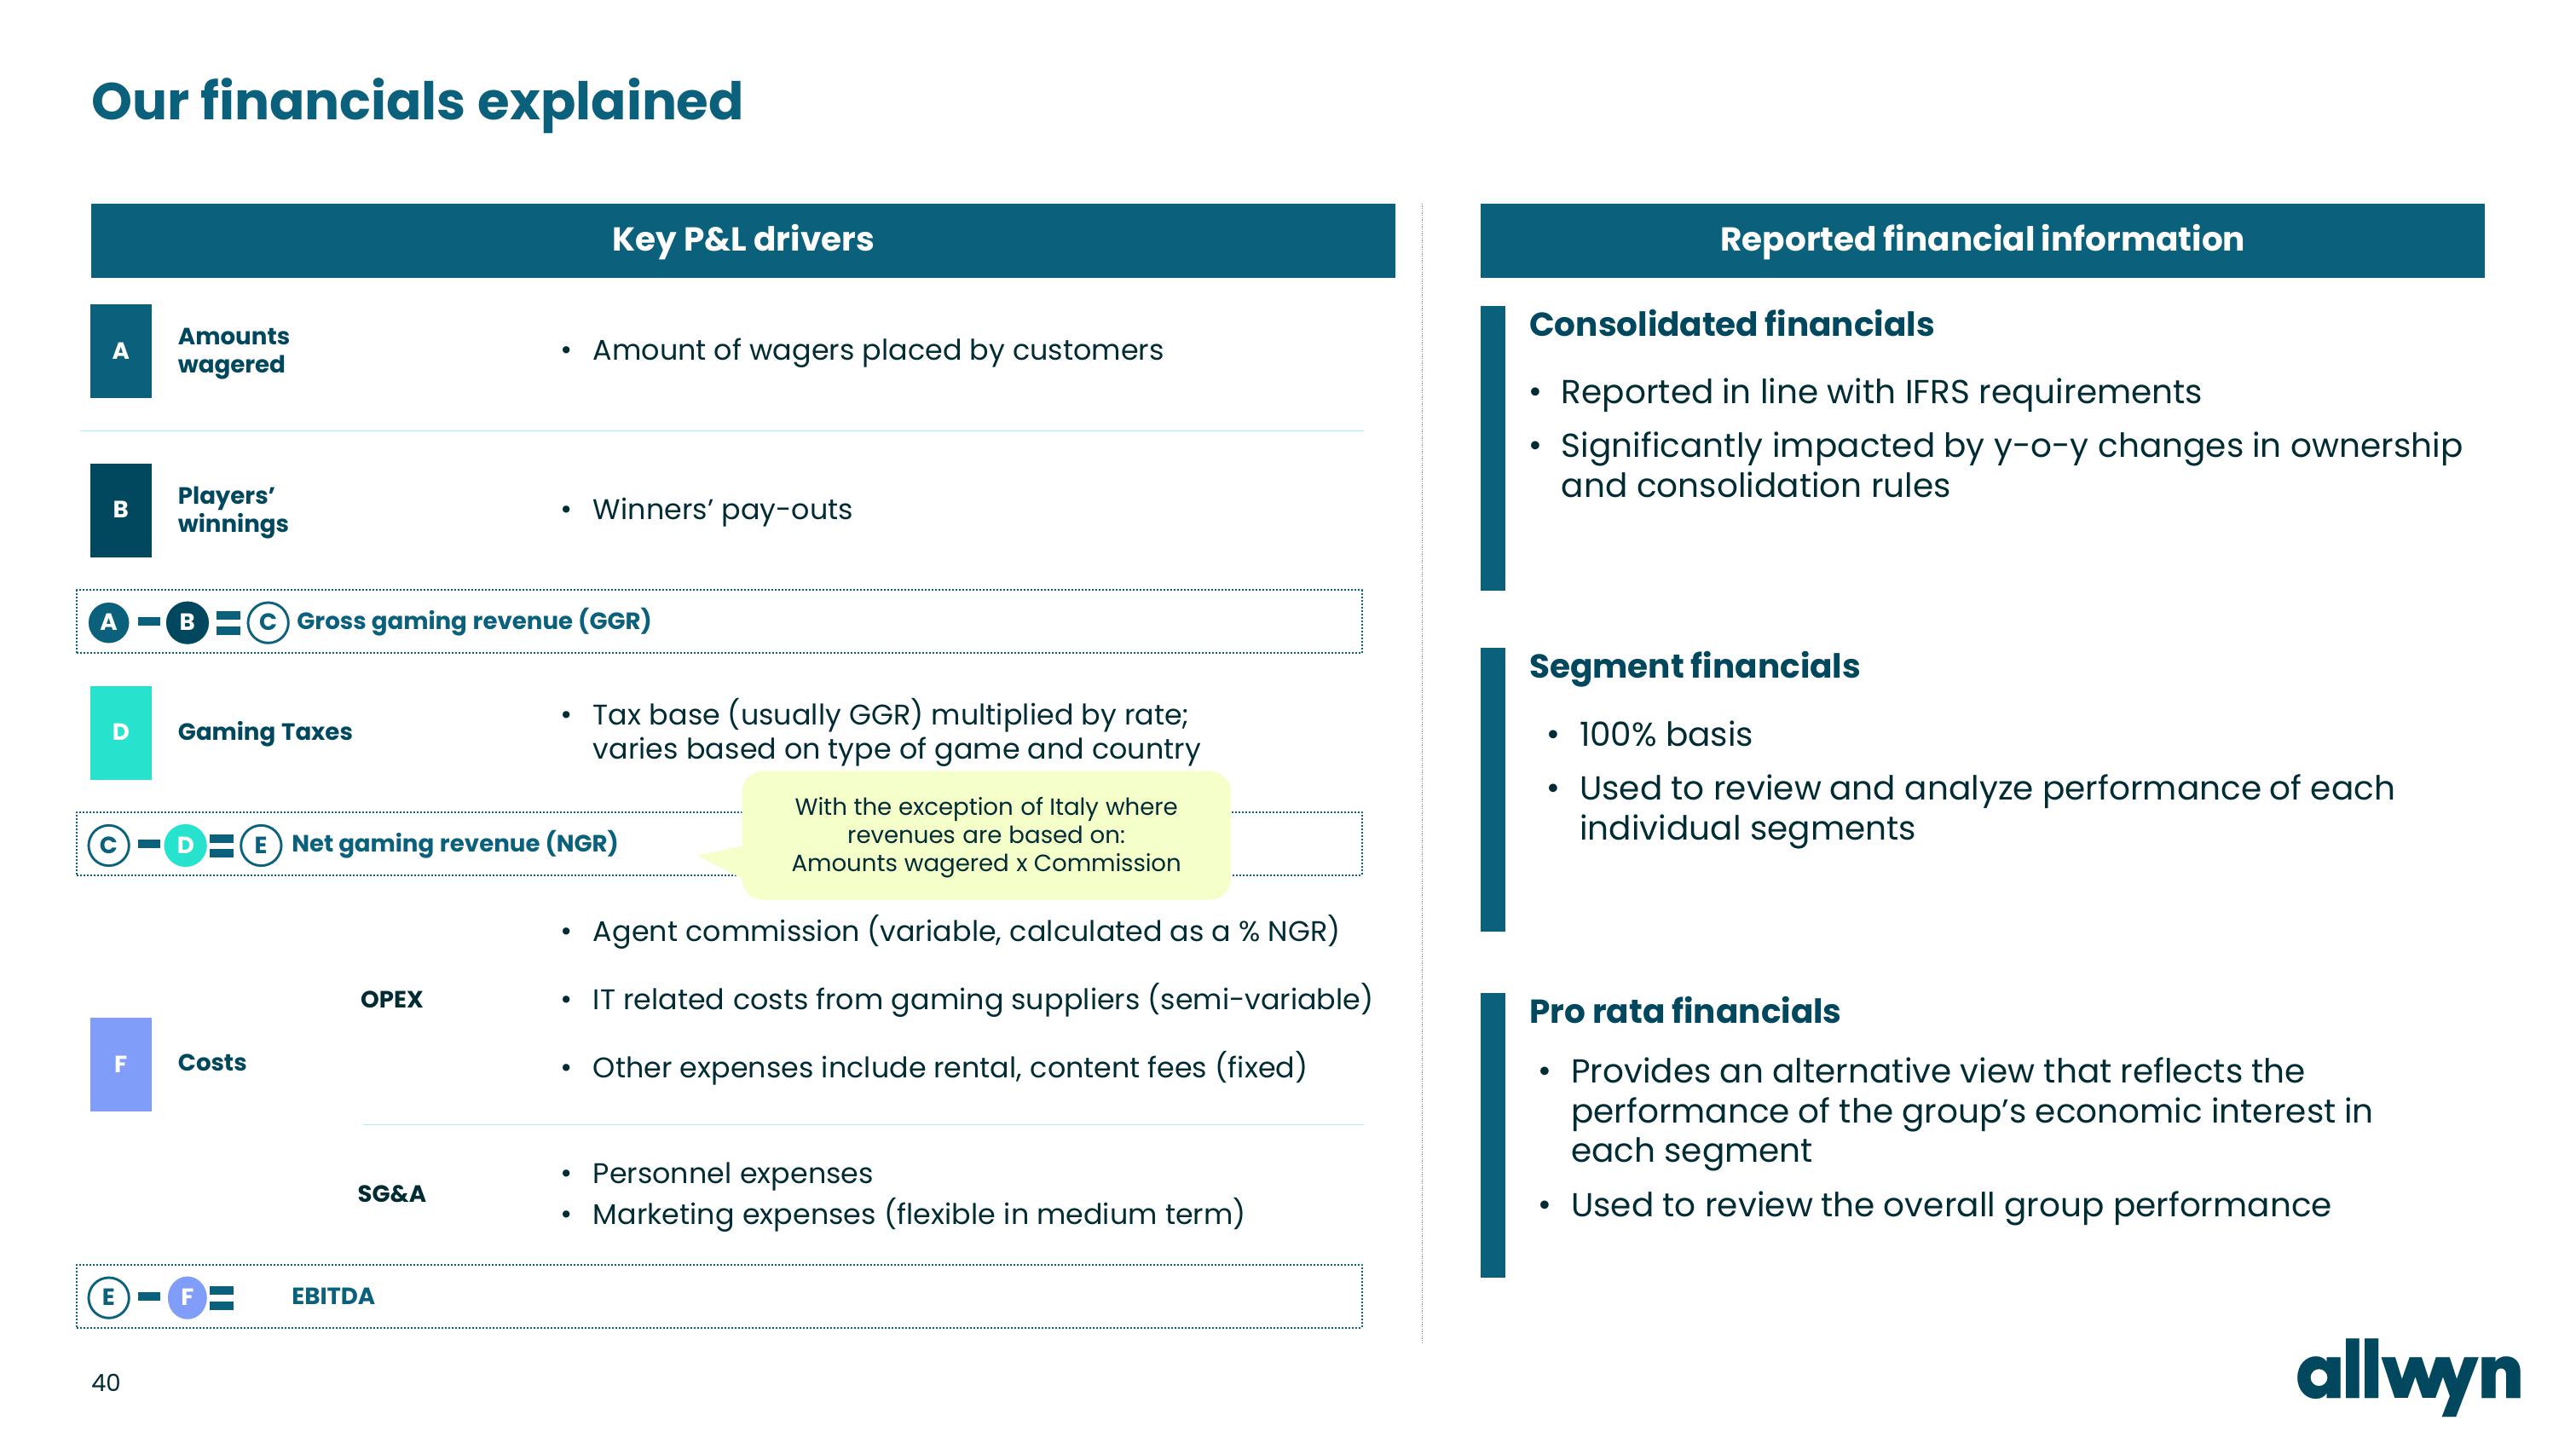
Our financials explained
A
B
A
D
F
E
40
Amounts
wagered
Players'
winnings
Gaming Taxes
Costs
B Gross gaming revenue (GGR)
OPEX
●
SG&A
EBITDA
●
(E) Net gaming revenue (NGR)
.
Key P&L drivers
●
Amount of wagers placed by customers
●
Winners' pay-outs
●
Agent commission (variable, calculated as a % NGR)
• IT related costs from gaming suppliers (semi-variable)
Other expenses include rental, content fees (fixed)
Tax base (usually GGR) multiplied by rate;
varies based on type of game and country
With the exception of Italy where
revenues are based on:
Amounts wagered x Commission
Personnel expenses
Marketing expenses (flexible in medium term)
Consolidated financials
Reported in line with IFRS requirements
Significantly impacted by y-o-y changes in ownership
and consolidation rules
●
Reported financial information
Segment financials
100% basis
●
• Used to review and analyze performance of each
individual segments
●
Pro rata financials
Provides an alternative view that reflects the
performance of the group's economic interest in
each segment
• Used to review the overall group performance
●
allwynView entire presentation