Maersk Results Presentation Deck
A.P. Moller Maersk Group
- Interim Report 02 2015
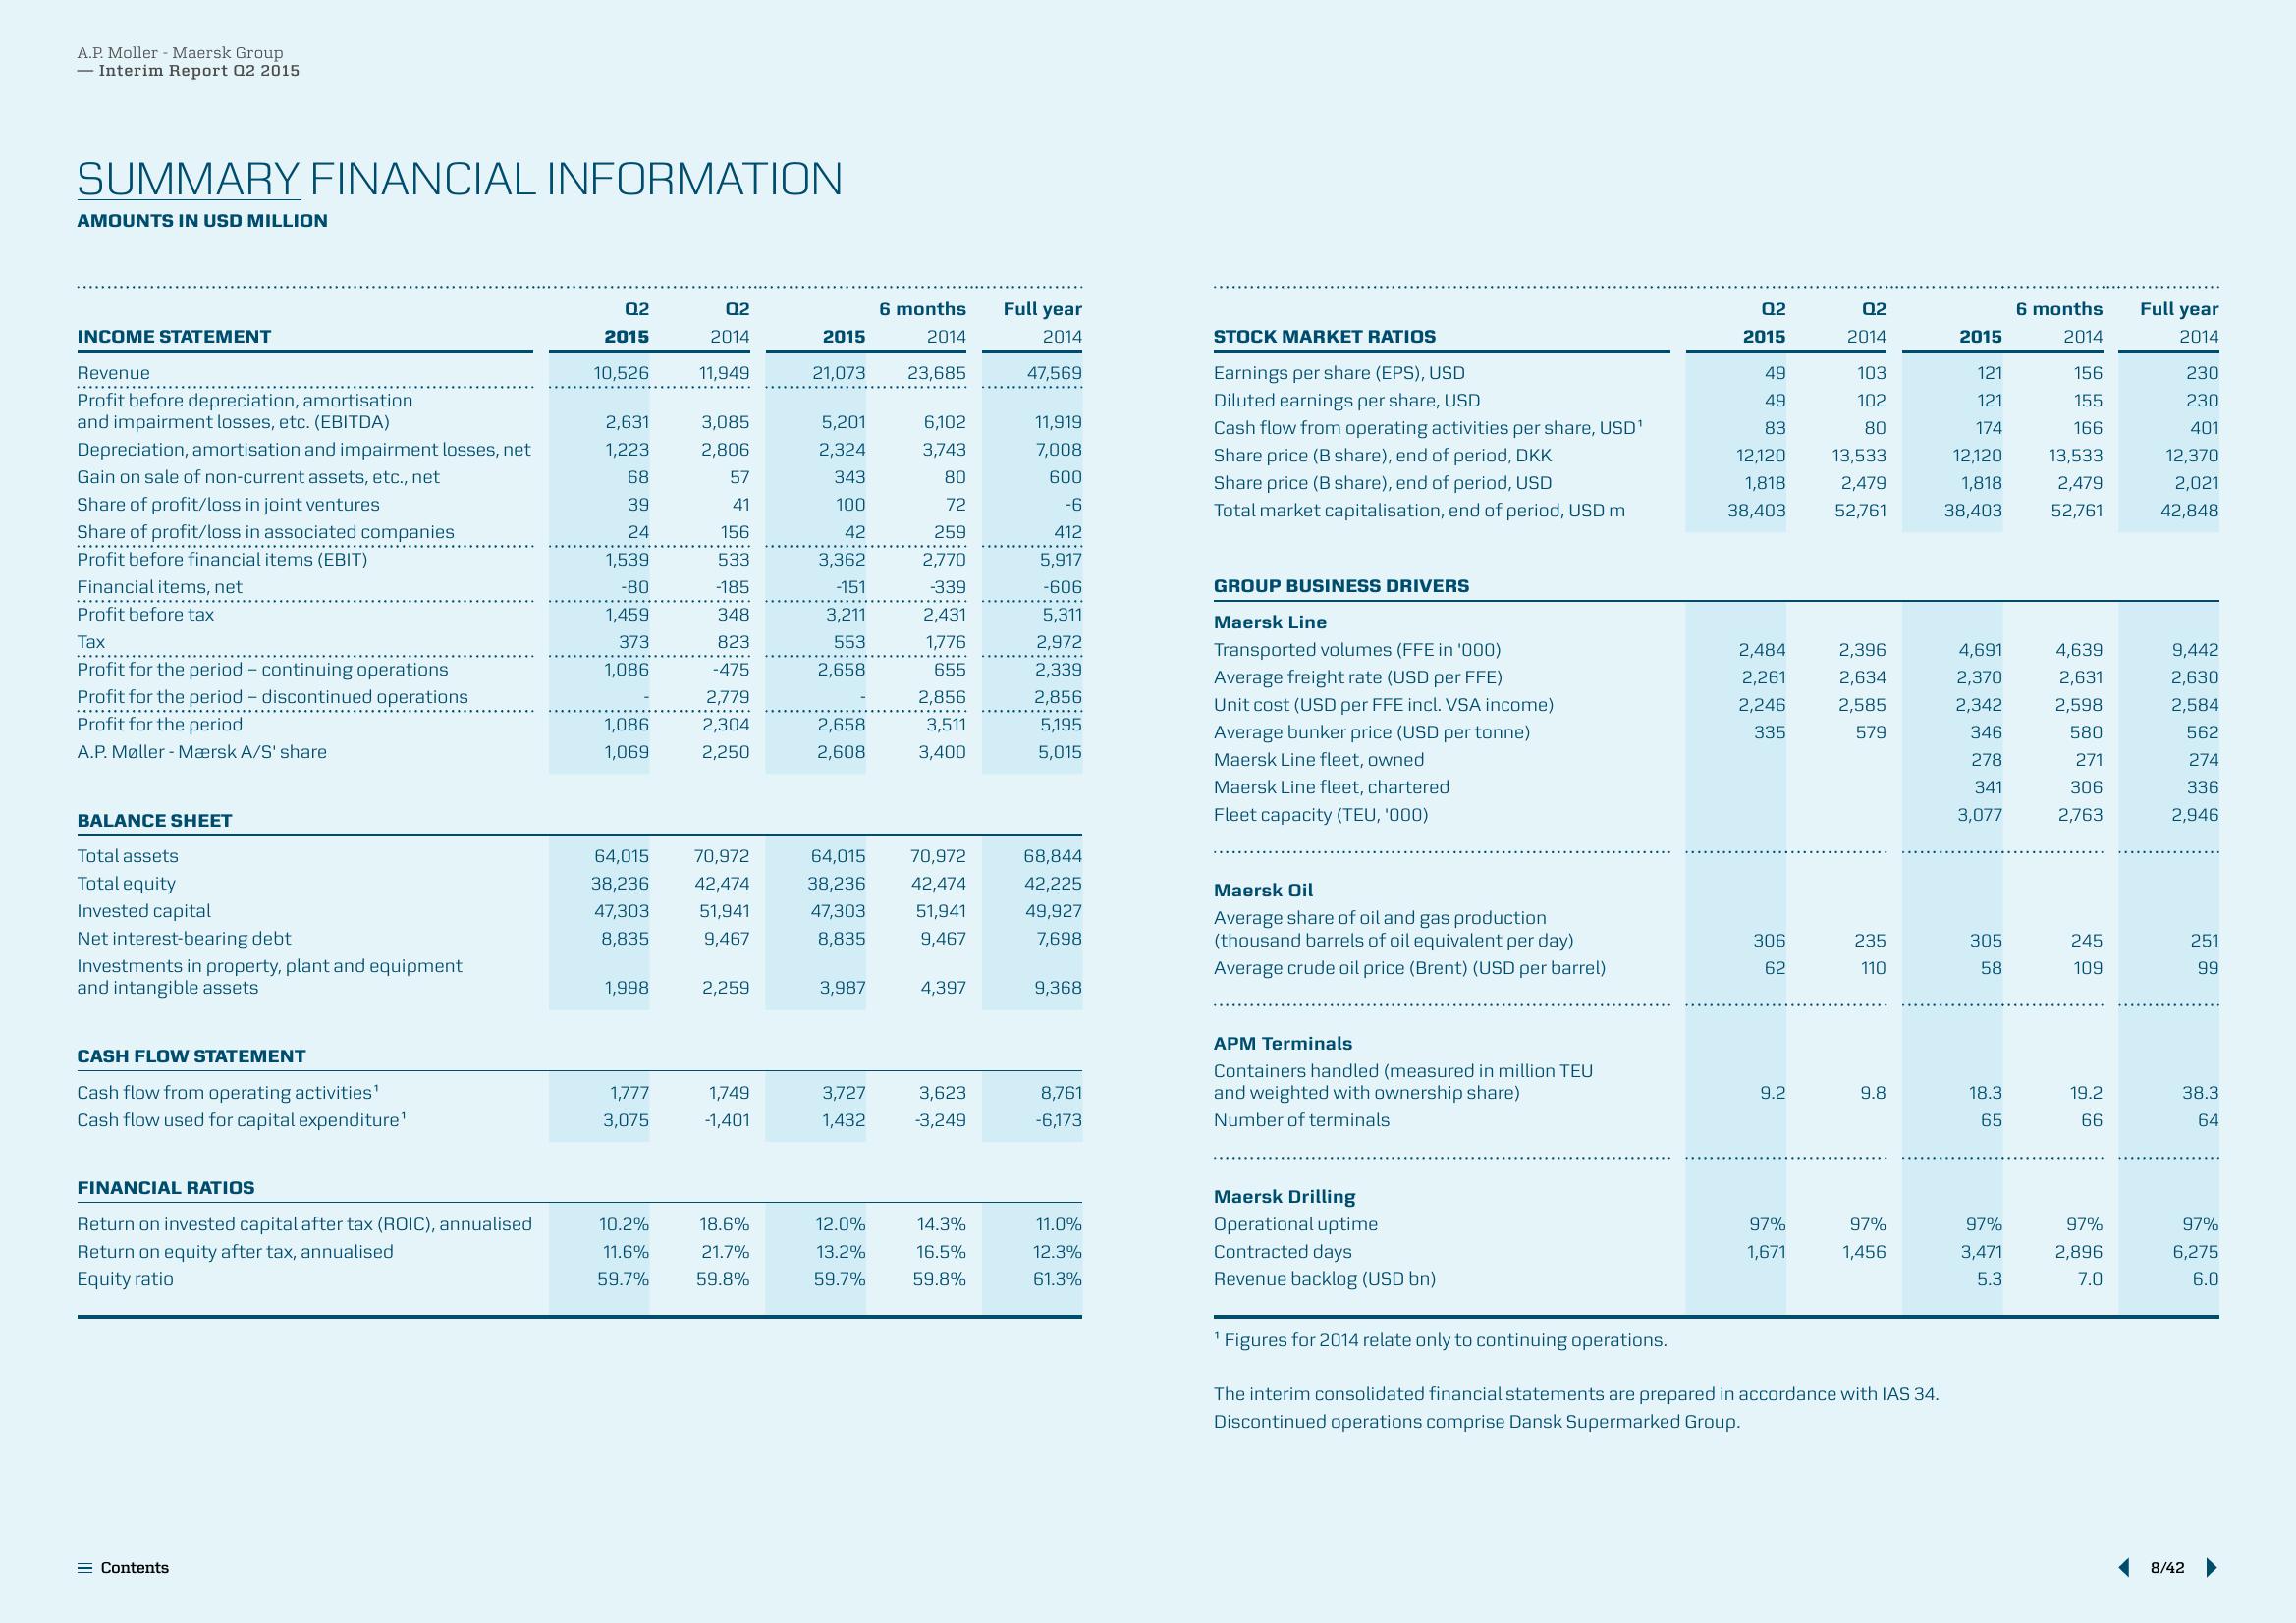
SUMMARY FINANCIAL INFORMATION
AMOUNTS IN USD MILLION
INCOME STATEMENT
Revenue
******
Profit before depreciation, amortisation
and impairment losses, etc. (EBITDA)
Depreciation, amortisation and impairment losses, net
Gain on sale of non-current assets, etc., net
Share of profit/loss in joint ventures
Share of profit/loss in associated companies
************
Profit before financial items (EBIT)
Financial items, net
Profit before tax
Tax
Profit for the period - continuing operations
Profit for the period - discontinued operations
Profit for the period
A.P. Møller-Mærsk A/S' share
BALANCE SHEET
Total assets
Total equity
Invested capital
Net interest-bearing debt
Investments in property, plant and equipment
and intangible assets
CASH FLOW STATEMENT
Cash flow from operating activities¹
Cash flow used for capital expenditure¹
FINANCIAL RATIOS
Return on invested capital after tax (ROIC), annualised
Return on equity after tax, annualised
Equity ratio
Contents
02
2015
10,526
2,631
1,223
68
39
24
1,539
-80
1,459
373
1,086
1,086
1,069
64,015
38,236
47,303
8,835
1,998
1,777
3,075
10.2%
11.6%
59.7%
02
2014
11,949
3,085
2,806
57
41
156
533
-185
348
823
-475
2,779
2,304
2,250
70,972
42,474
51,941
9,467
2,259
1,749
-1,401
18.6%
21.7%
59.8%
2015
21,073
5,201
2,324
343
100
42
3,362
-151
3,211
553
2,658
2,658
2,608
64,015
38,236
47,303
8,835
3,987
3,727
1,432
12.0%
13.2%
59.7%
6 months
2014
23,685
6,102
3,743
80
72
259
2,770
-339
2,431
1,776
655
2,856
3,511
3,400
70,972
42,474
51,941
9,467
4,397
3,623
-3,249
14.3%
16.5%
59.8%
Full year
2014
47,569
11,919
7,008
600
-6
412
5,917
-606
5,311
2,972
2,339
2,856
5,195
5,015
68,844
42,225
49,927
7,698
9,368
8,761
-6,173
11.0%
12.3%
61.3%
STOCK MARKET RATIOS
Earnings per share (EPS), USD
Diluted earnings per share, USD
Cash flow from operating activities per share, USD¹
Share price (B share), end of period, DKK
Share price (B share), end of period, USD
Total market capitalisation, end of period, USD m
GROUP BUSINESS DRIVERS
Maersk Line
Transported volumes (FFE in '000)
Average freight rate (USD per FFE)
Unit cost (USD per FFE incl. VSA income)
Average bunker price (USD per tonne)
Maersk Line fleet, owned
Maersk Line fleet, chartered
Fleet capacity (TEU, '000)
Maersk Oil
Average share of oil and gas production
(thousand barrels of oil equivalent per day)
Average crude oil price (Brent) (USD per barrel)
APM Terminals
Containers handled (measured in million TEU
and weighted with ownership share)
Number of terminals
Maersk Drilling
Operational uptime
Contracted days
Revenue backlog (USD bn)
1 Figures for 2014 relate only to continuing operations.
02
2015
49
49
83
12,120
1,818
38,403
2,484
2,261
2,246
335
306
62
9.2
97%
1,671
02
2014
103
102
80
13,533
2,479
52,761
2,396
2,634
2,585
579
235
110
9.8
97%
1,456
The interim consolidated financial statements are prepared in accordance with IAS 34.
Discontinued operations comprise Dansk Supermarked Group.
2015
121
121
174
12,120
1,818
38,403
4,691
2,370
2,342
346
278
341
3,077
305
58
18.3
65
97%
3,471
5.3
6 months
2014
156
155
166
13,533
2,479
52,761
4,639
2,631
2,598
580
271
306
2,763
245
109
19.2
66
97%
2,896
7.0
Full year
2014
230
230
401
12,370
2,021
42,848
9,442
2,630
2,584
562
274
336
2,946
251
99
38.3
64
97%
6,275
6.0
8/42View entire presentation