Evercore Investment Banking Pitch Book
Financial Analysis
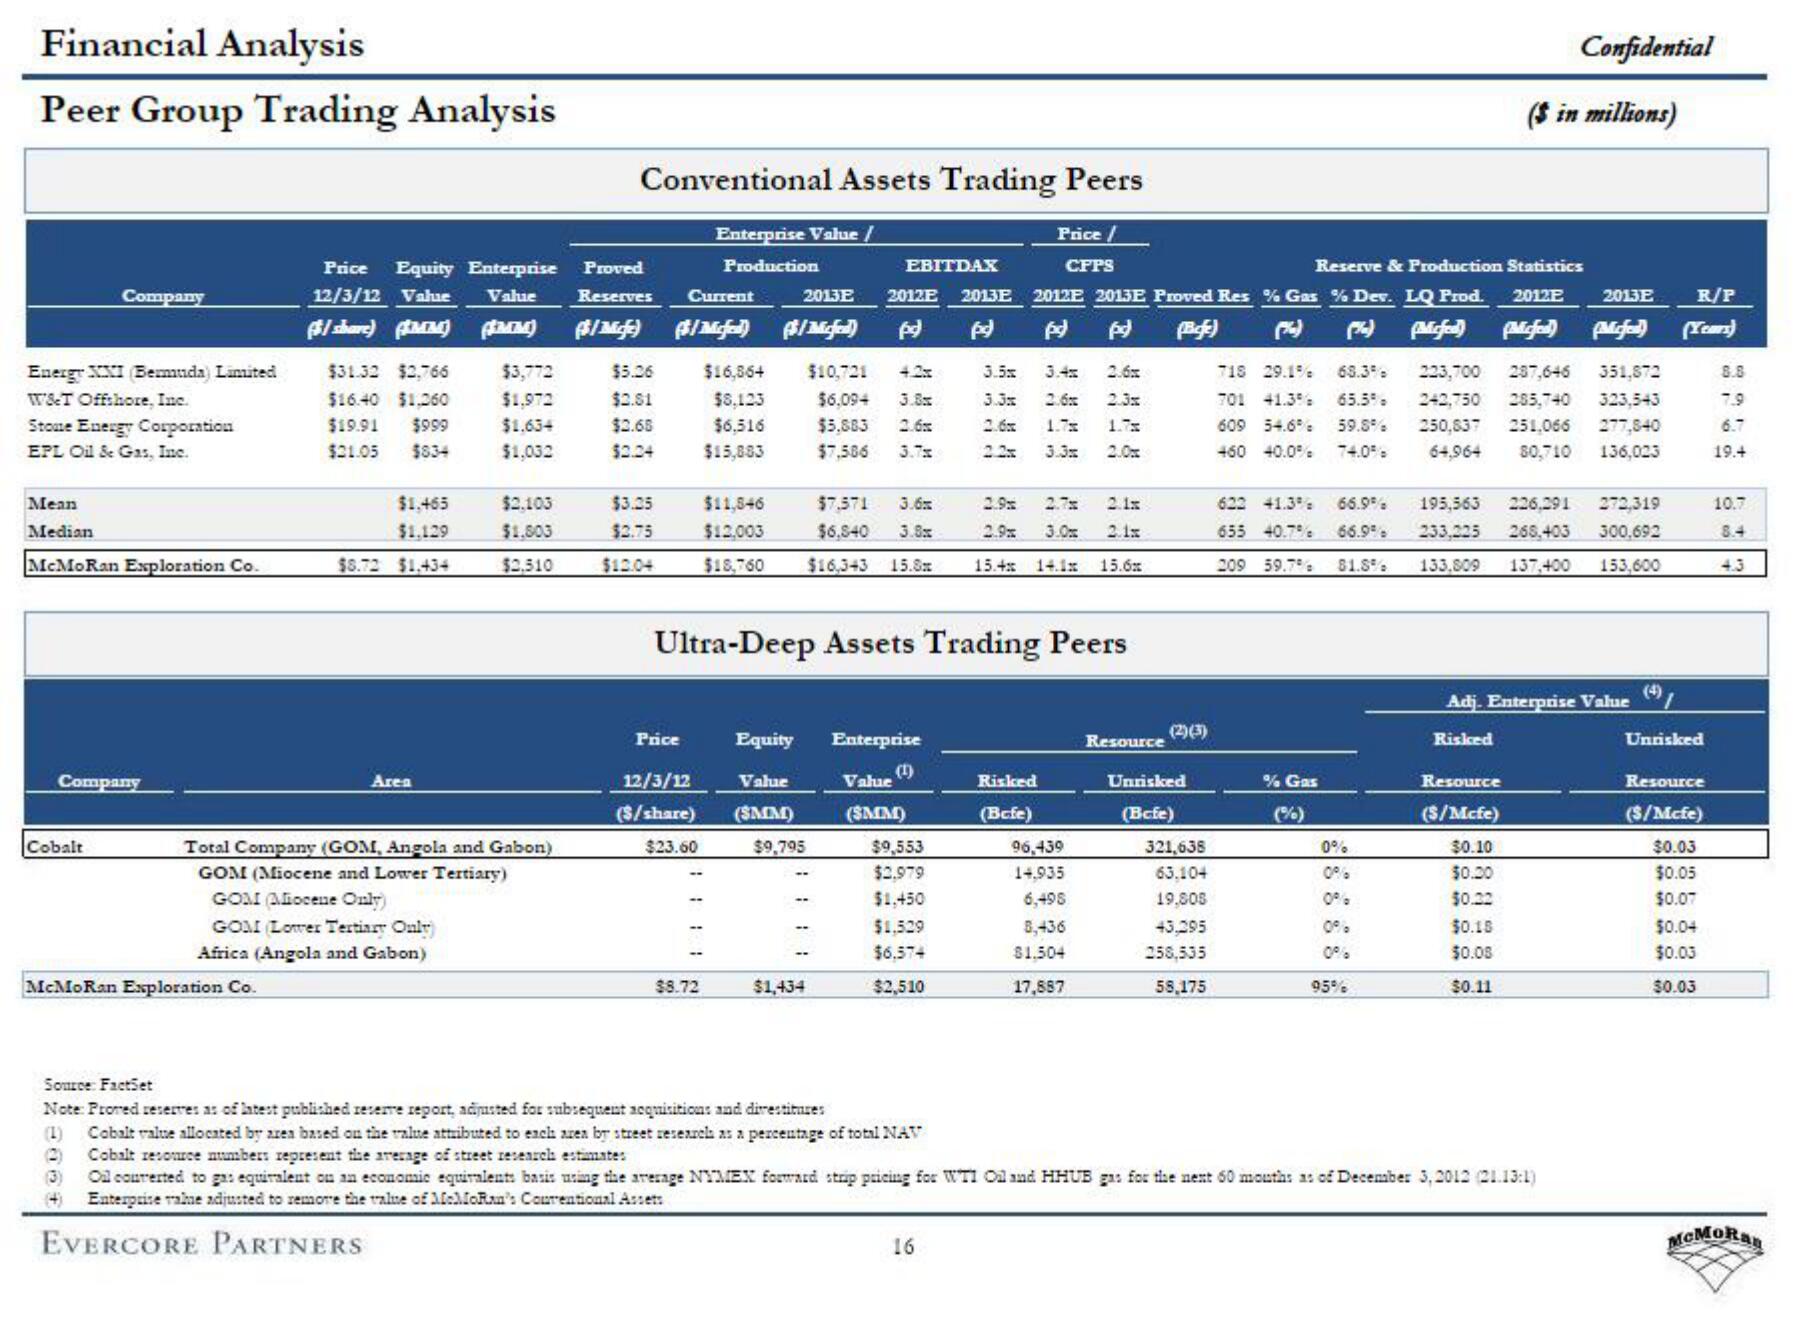
Peer Group Trading Analysis
Energy XXI (Bermuda) Limited
W&T Offshore, Inc.
Stone Energy Corporation
EPL Oil & Gas, Inc.
Company
Mean
Median
McMoRan Exploration Co.
Company
Cobalt
McMoRan Exploration Co.
(3)
(+)
Price Equity Enterprise
12/3/12 Value Value
($/share) (MM) (JMM)
$31.32 $2.766
$16.40 $1,260
$19.91 $999
$21.05 $834
$1.465
$1,129
$8.72 $1,434
Area
$3,772
$1,972
$1.634
$1,032
$2.103
$1.803
$2,510
Total Company (GOM, Angola and Gabon)
GOM (Miocene and Lower Tertiary)
GOM Aiocene Only)
GOM (Lower Tertiary Only
Africa (Angola and Gabon)
Conventional Assets Trading Peers
Enterprise Value /
Price /
CFPS
Production
Proved
Reserves
Current
2013E 2012E 2013E
($/Mcfc) $/Mefed) ($/Micfied) pd (pd)
$5.26
$2.51
$2.68
$2.24
$3.25
$2.75
$12.04
Price
$16,864
$8,123
$6.516
$15,883
$8.72
EBITDAX
Value
12/3/12
($/share) (SMM)
$23.60
$9,795
$10,721
$6,094
3.8x
$5.883 2.6x
$7,586
3.7%
Equity Enterprise
Value
(SMM)
$1,434
$11,546
$7.571 3.6
$12,003 $6,540 3.8x
$18,760 $16,343 15.8x
Ultra-Deep Assets Trading Peers
(1)
$9,553
$2.979
$1,450
$1.529
$6.574
$2,510
3.5x
3.3x
16
Reserve & Production Statistics
2012E 2013E Proved Res % Gas % Dev. LQ Prod. 2012E
pd pd (Beje)
3.4x 2.6x
2.6x 2.3x
Risked
(Befe)
2.9
2.9
2.1x
2.1x
15.4 14.1x 15.6x
2.0x
3.0
96,439
14,935
6,498
8,436
$1.504
17,887
Resource
(2)(3)
Unrisked
(Befe)
321,638
63.104
19,808
43.295
258,535
58,175
718 29.1%
701 41.3%
609 54.6%
460 40.0%
622 41.3% 66.9%
655 40.7% 66.9%
209 59.7%
81.8%
% Gas
2013E R/P
(Micfed) Mefed) (Years)
63.3% 223,700 287,646 351,872
65.5% 242,750 285,740 323,543
59.8% 250,837 251,066 277,840
74.0% 64.964 80,710 136,023
0%
0%
Confidential
($ in millions)
95%
195,563 226,291 272,319
233,225 268,403 300,692
133,809 137,400 153,600
Adj. Enterprise Value
Risked
Resource
($/Mcfe)
$0.10
$0.00
$0.22
$0.15
$0.08
$0.11
Source: FactSet
Note: Prored reserves as of latest published reserve report, adjusted for subsequent acquisitions and direstitures
(1) Cobalt value allocated by area based on the value attributed to each area by street research as a percentage of total NAV
Cobalt resource numbers represent the average of street research estimates
Oil converted to gas equivalent on an economic equivalents basis using the average NYMEX forward strip pricing for WTI Oil and HHUB gas for the next 60 months as of December 3, 2012 (21.13:1)
Enterprise rakue adjusted to remove the value of MeloRan's Courentional Assets
EVERCORE PARTNERS
(4)
Unrisked
Resource
($/Mcfe)
$0.03
$0.05
$0.07
$0.04
$0.03
$0.03
8.8
7.9
6.7
19.4
10.7
8.4
4.3
MCMoRayView entire presentation