Nexters SPAC Presentation Deck
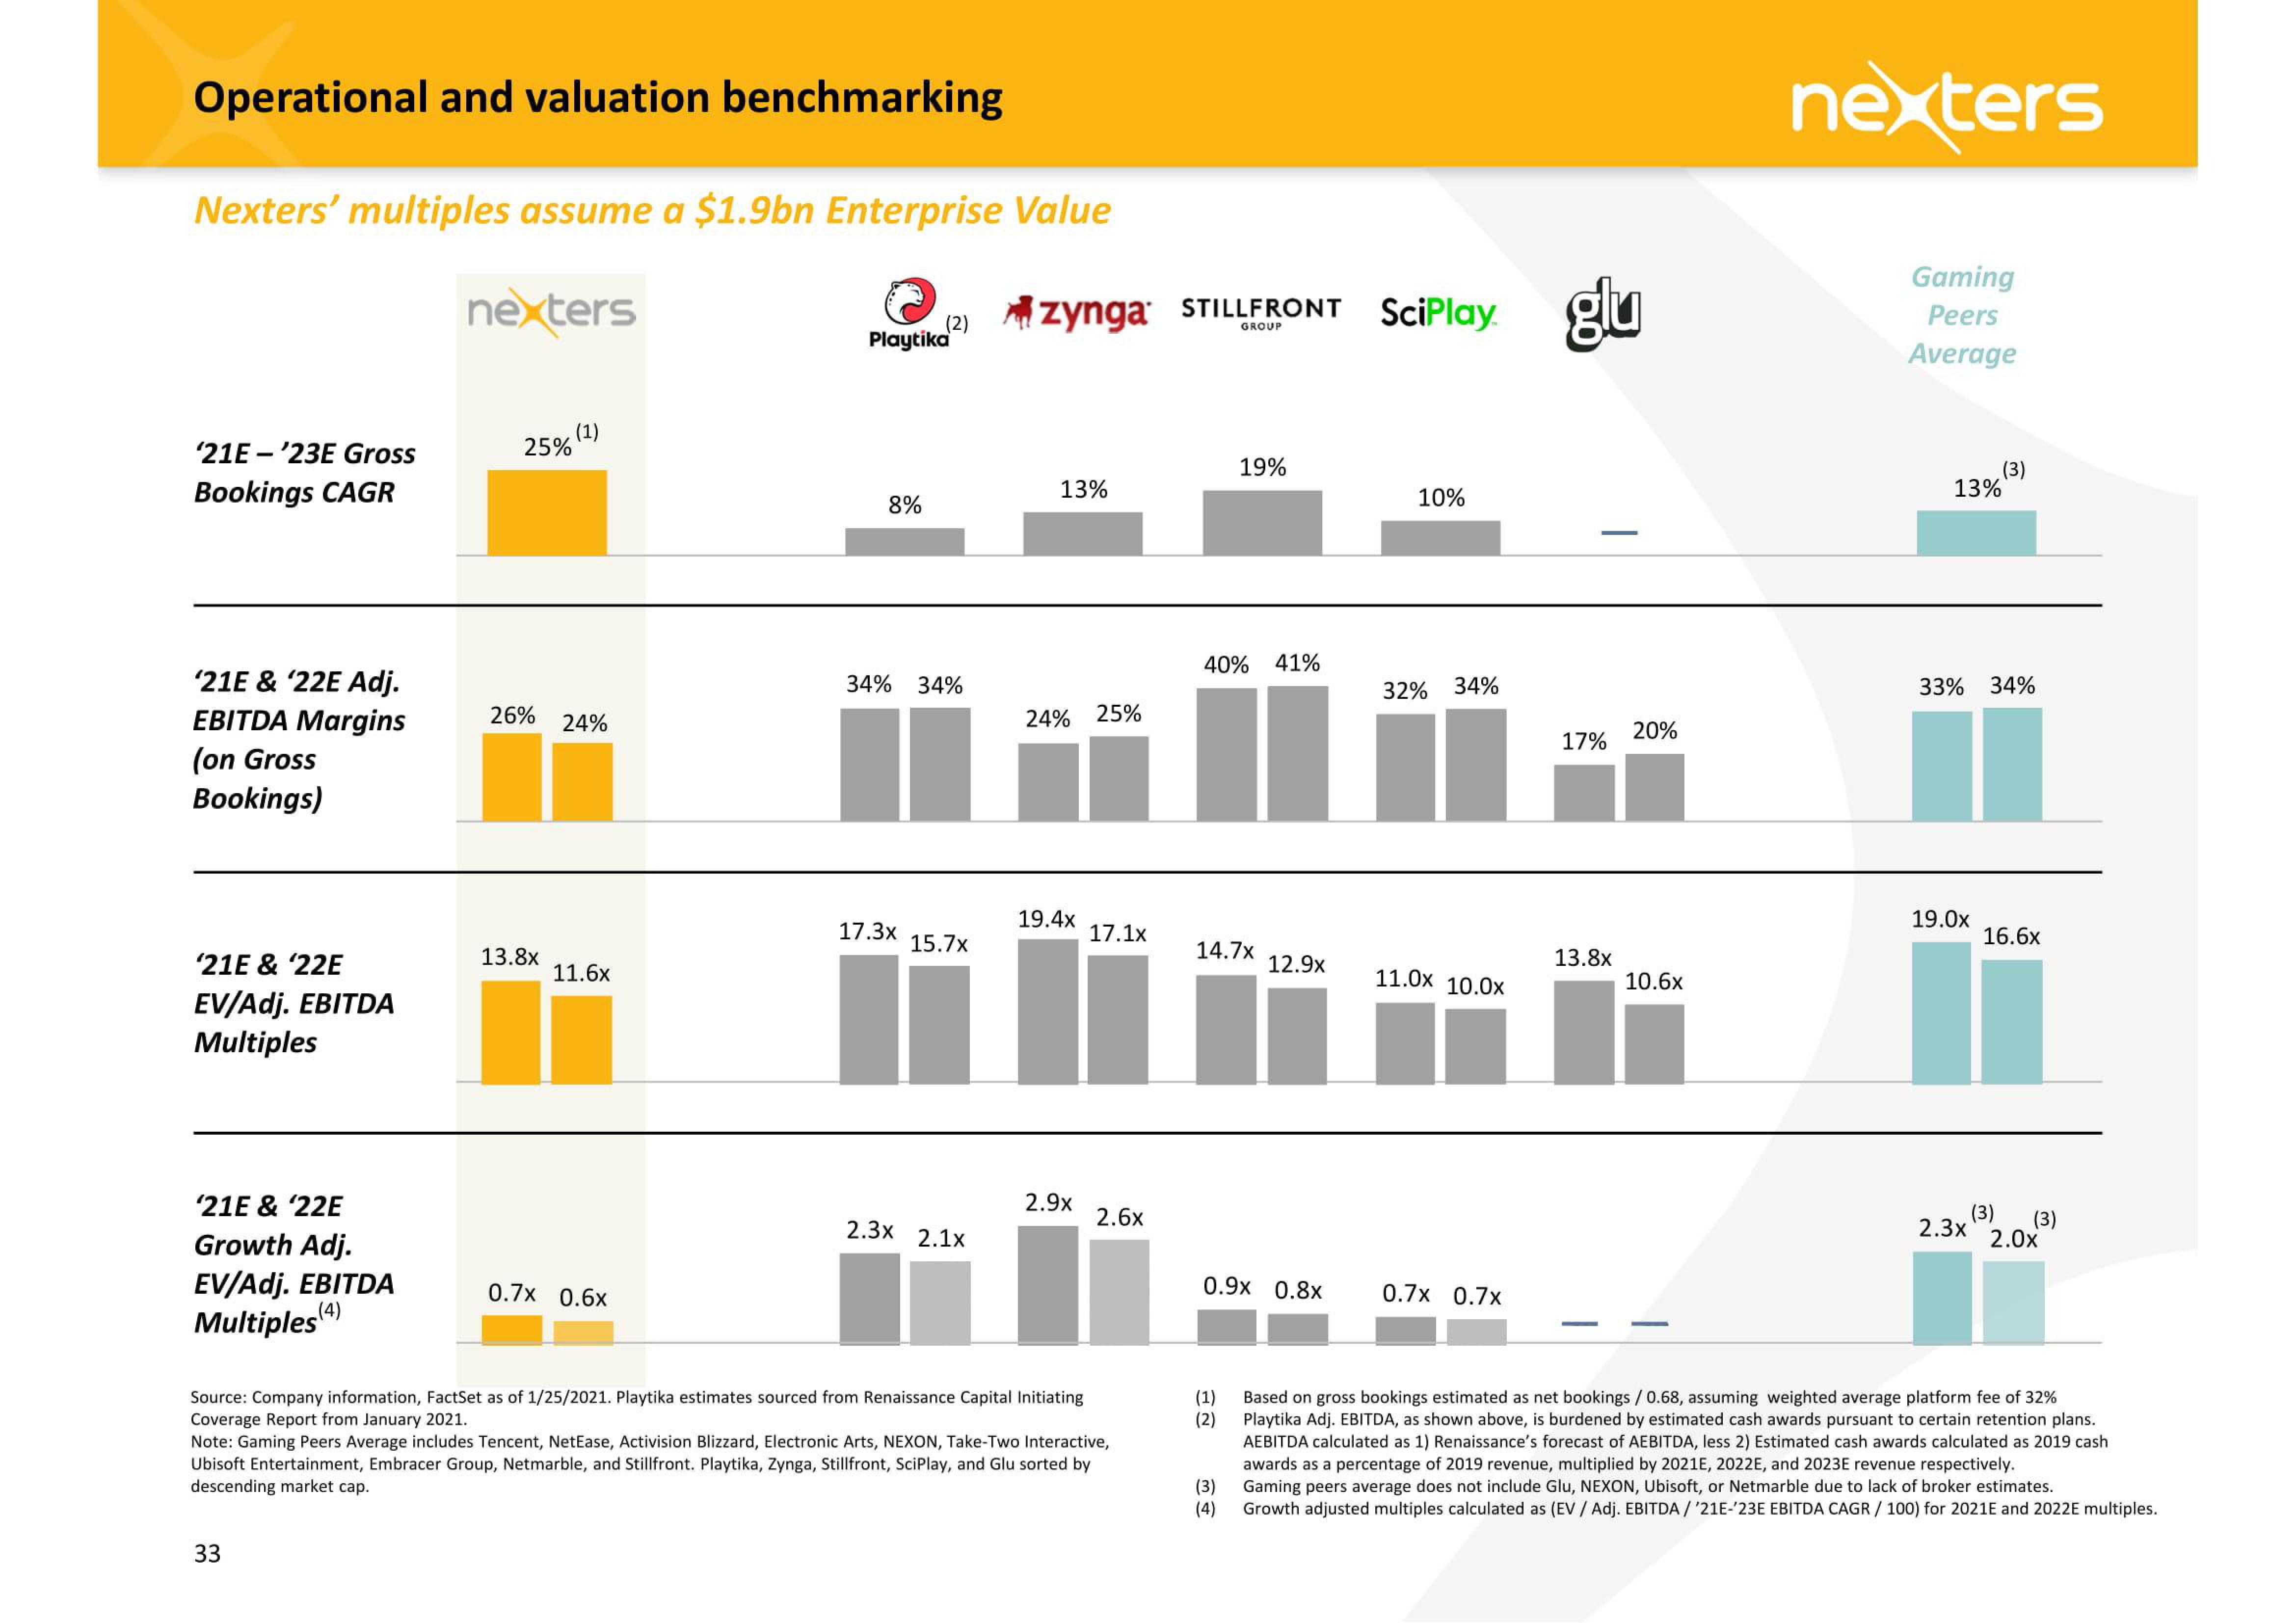
Operational and valuation benchmarking
Nexters' multiples assume a $1.9bn Enterprise Value
nexters
'21E-'23E Gross
Bookings CAGR
'21E & '22E Adj.
EBITDA Margins
(on Gross
Bookings)
'21E & '22E
V/Adj. EBITDA
Multiples
'21E & '22E
Growth Adj.
EV/Adj. EBITDA
Multiples (4)
25%
33
(1)
26% 24%
13.8x
11.6x
0.7x 0.6x
(2)
Playtika
8%
34% 34%
17.3x 15.7x
2.3x 2.1x
zynga STILLFRONT SciPlay. glu
GROUP
13%
24% 25%
19.4x
2.9x
Source: Company information, FactSet as of 1/25/2021. Playtika estimates sourced from Renaissance Capital Initiating
Coverage Report from January 2021.
17.1x
2.6x
Note: Gaming Peers Average includes Tencent, NetEase, Activision Blizzard, Electronic Arts, NEXON, Take-Two Interactive,
Ubisoft Entertainment, Embracer Group, Netmarble, and Stillfront. Playtika, Zynga, Stillfront, SciPlay, and Glu sorted by
descending market cap.
40% 41%
19%
14.7x
(1)
(2)
0.9x 0.8x
(3)
(4)
12.9x
10%
32% 34%
11.0x 10.0x
0.7x 0.7x
17%
13.8x
20%
10.6x
nexters
Gaming
Peers
Average
(3)
13%
33% 34%
19.0x
16.6x
(3)
2.3x 2.0x
(3)
Based on gross bookings estimated as net bookings / 0.68, assuming weighted average platform fee of 32%
Playtika Adj. EBITDA, as shown above, is burdened by estimated cash awards pursuant to certain retention plans.
AEBITDA calculated as 1) Renaissance's forecast of AEBITDA, less 2) Estimated cash awards calculated as 2019 cash
awards as a percentage of 2019 revenue, multiplied by 2021E, 2022E, and 2023E revenue respectively.
Gaming peers average does not include Glu, NEXON, Ubisoft, or Netmarble due to lack of broker estimates.
Growth adjusted multiples calculated as (EV / Adj. EBITDA/ '21E-'23E EBITDA CAGR / 100) for 2021E and 2022E multiples.View entire presentation