Ashtead Group Results Presentation Deck
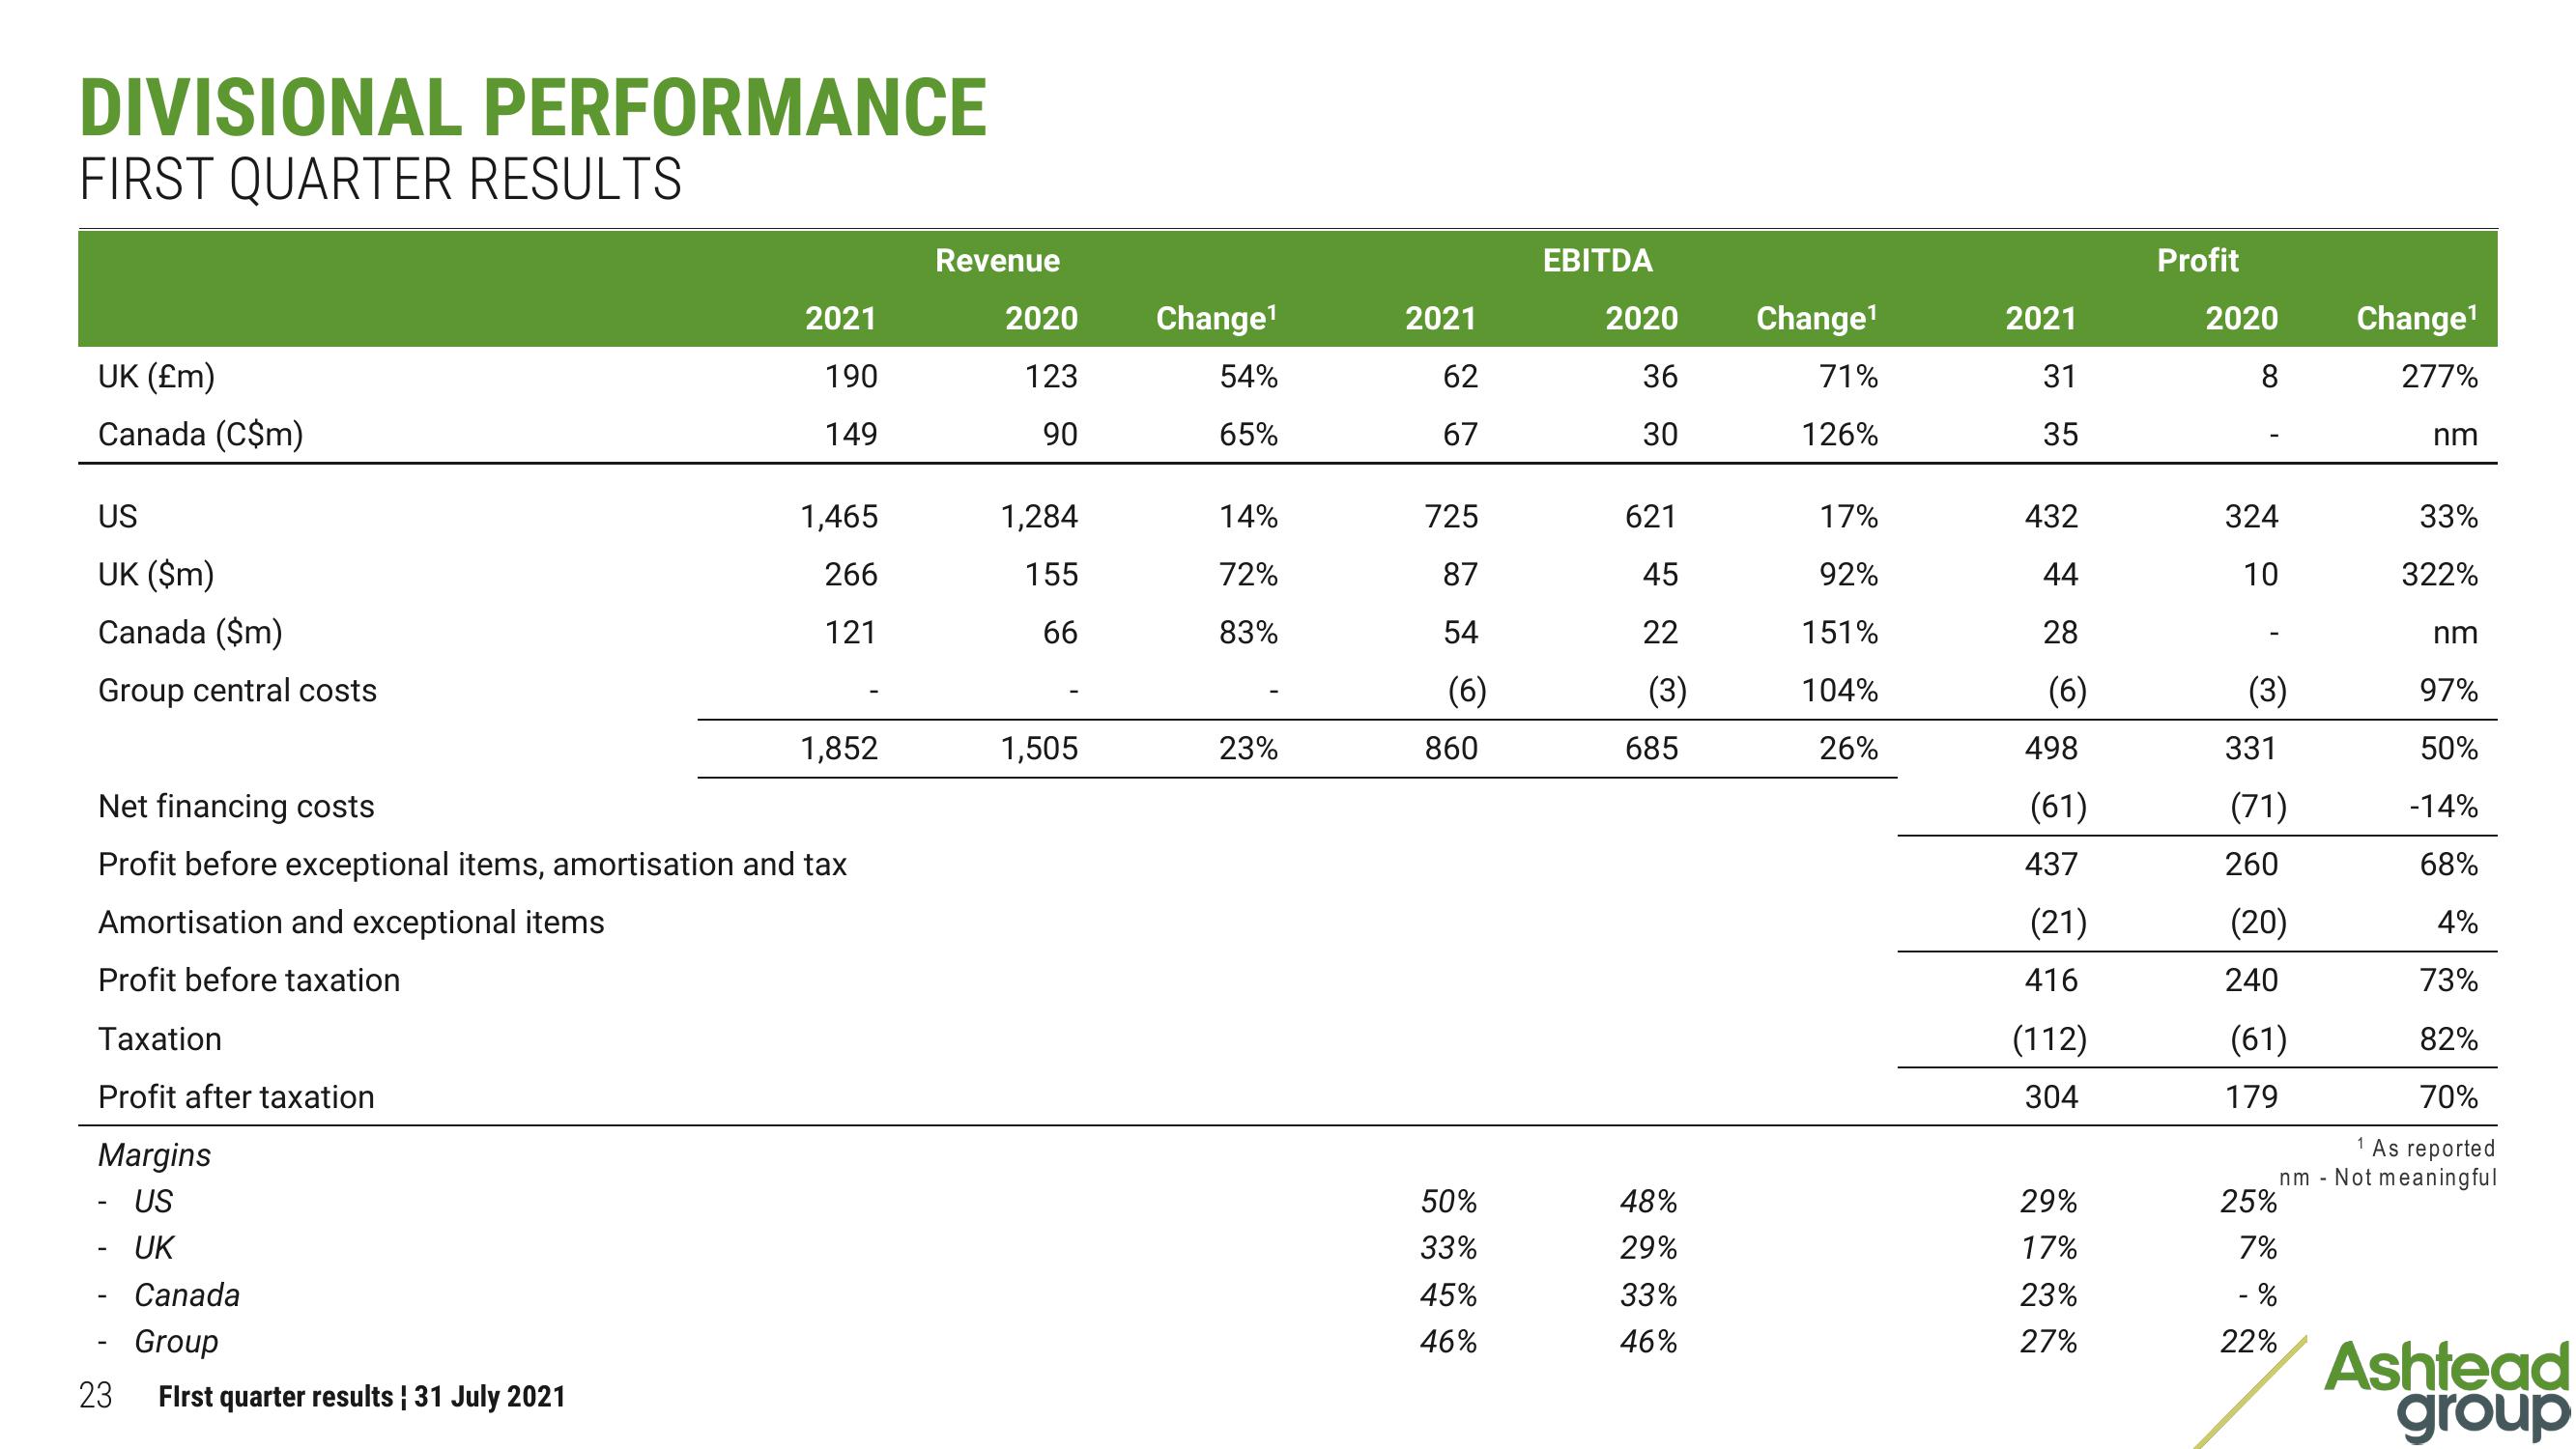
DIVISIONAL PERFORMANCE
FIRST QUARTER RESULTS
UK (£m)
Canada (C$m)
US
UK ($m)
Canada ($m)
Group central costs
Amortisation and exceptional items
Profit before taxation
Taxation
Profit after taxation
Margins
- US
UK
23
2021
190
149
Net financing costs
Profit before exceptional items, amortisation and tax
Canada
Group
First quarter results | 31 July 2021
1,465
266
121
1,852
Revenue
2020
123
90
1,284
155
66
1,505
Change¹
54%
65%
14%
72%
83%
23%
2021
62
67
725
87
54
(6)
860
50%
33%
45%
46%
EBITDA
2020
36
30
621
45
22
(3)
685
48%
29%
33%
46%
Change¹
71%
126%
17%
92%
151%
104%
26%
2021
31
35
432
44
28
(6)
498
(61)
437
(21)
416
(112)
304
29%
17%
23%
27%
Profit
2020
324
10
(3)
331
(71)
260
(20)
240
(61)
179
Change¹
277%
97%
50%
-14%
68%
4%
73%
82%
70%
1 As reported
nm - Not meaningful
25%
7%
- %
22%
nm
33%
322%
nm
Ashtead
groupView entire presentation