NewFortress Energy 2Q23 Results
(in thousands of U.S. dollars)
Net income
Add: Interest expense
Add: Tax provision (benefit)
Add: Contract termination charges and loss on mitigation sales
Add: Depreciation and amortization
Add: Asset impairment expense
Add: SG&A items excluded from Core SG&A
Add: Transaction and integration costs
Add: Other (income) expense, net
Add: Changes in fair value of non-hedge derivative instruments and
contingent consideration
Add: Loss on extinguishment of debt, net
Add: Pro rata share of Adjusted EBITDA from unconsolidated
entities
Less: Loss (income) from equity method investments
Add: Contract acquisition cost
Adjusted EBITDA (non-GAAP)
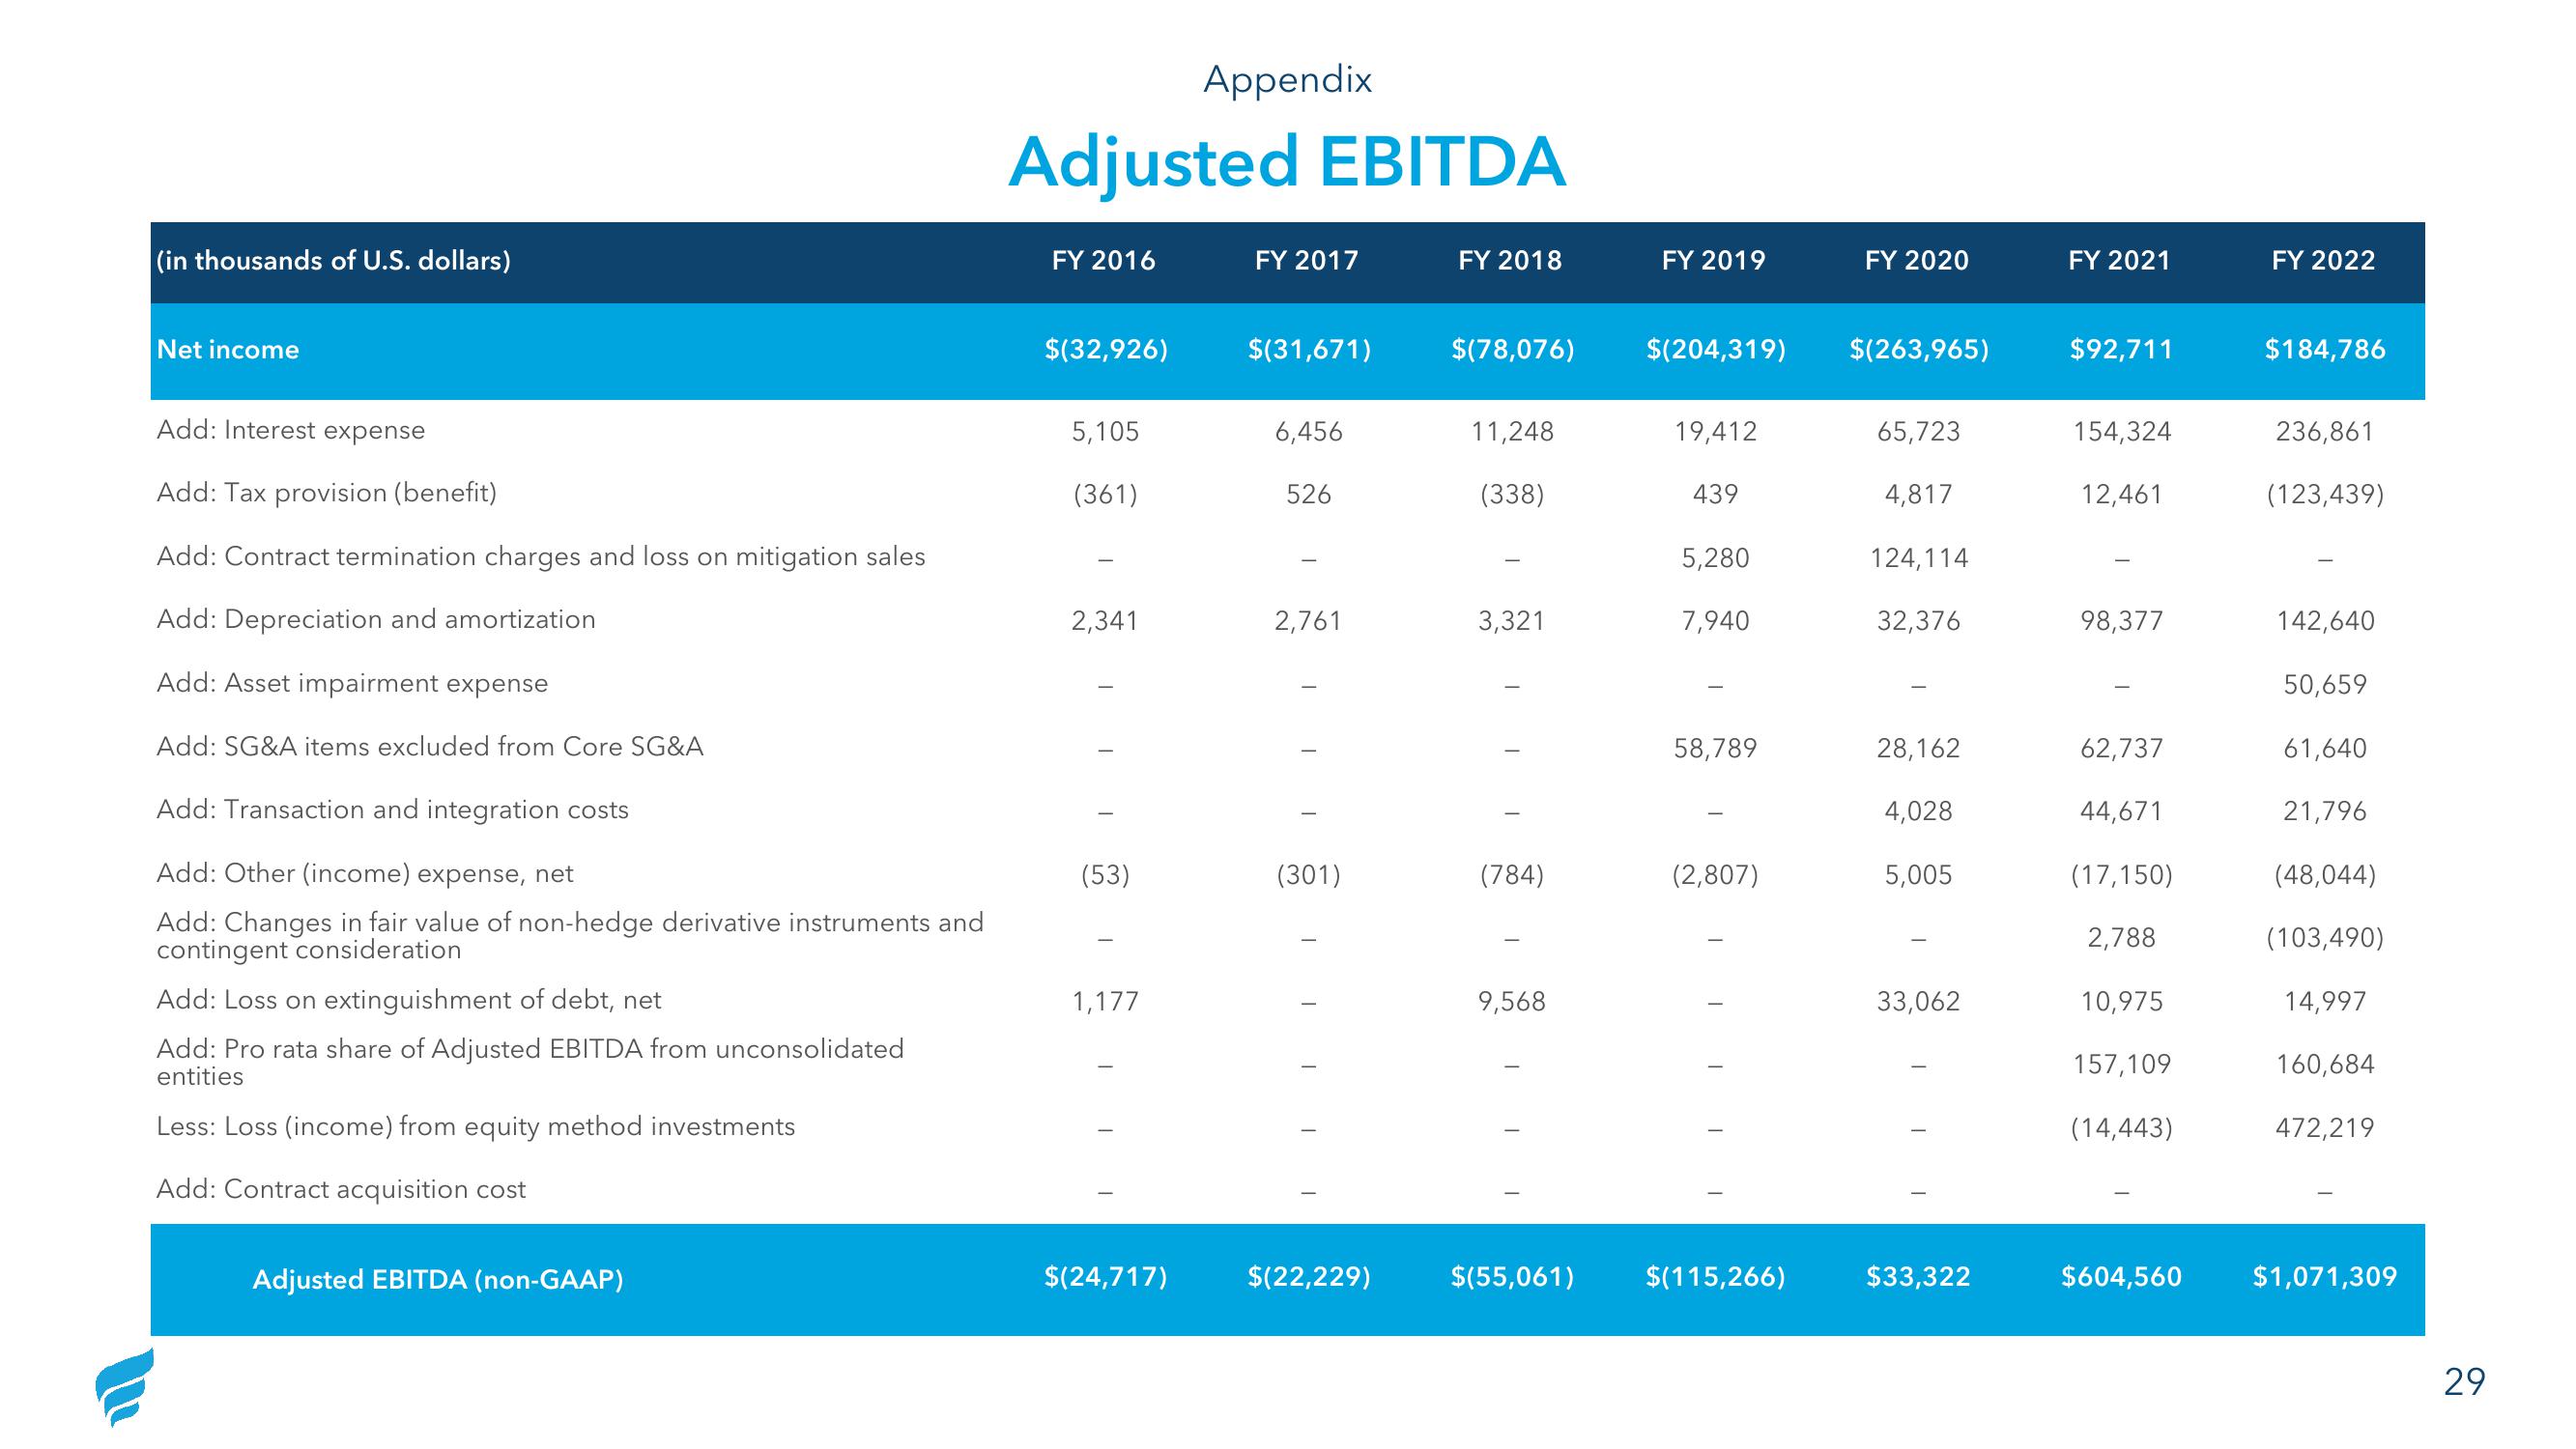
Adjusted EBITDA
FY 2016
$(32,926)
5,105
(361)
2,341
I
(53)
1,177
Appendix
$(24,717)
FY 2017
$(31,671)
6,456
526
2,761
1
I
I
(301)
T
$(22,229)
FY 2018
$(78,076)
11,248
(338)
3,321
T
I
T
(784)
9,568
$(55,061)
FY 2019
$(204,319)
19,412
439
5,280
7,940
58,789
(2,807)
$(115,266)
FY 2020
$(263,965)
65,723
4,817
124,114
32,376
28,162
4,028
5,005
33,062
$33,322
FY 2021
$92,711
154,324
12,461
98,377
62,737
44,671
(17,150)
2,788
10,975
157,109
(14,443)
$604,560
FY 2022
$184,786
236,861
(123,439)
142,640
50,659
61,640
21,796
(48,044)
(103,490)
14,997
160,684
472,219
$1,071,309
29View entire presentation