Dragonfly Energy SPAC Presentation Deck
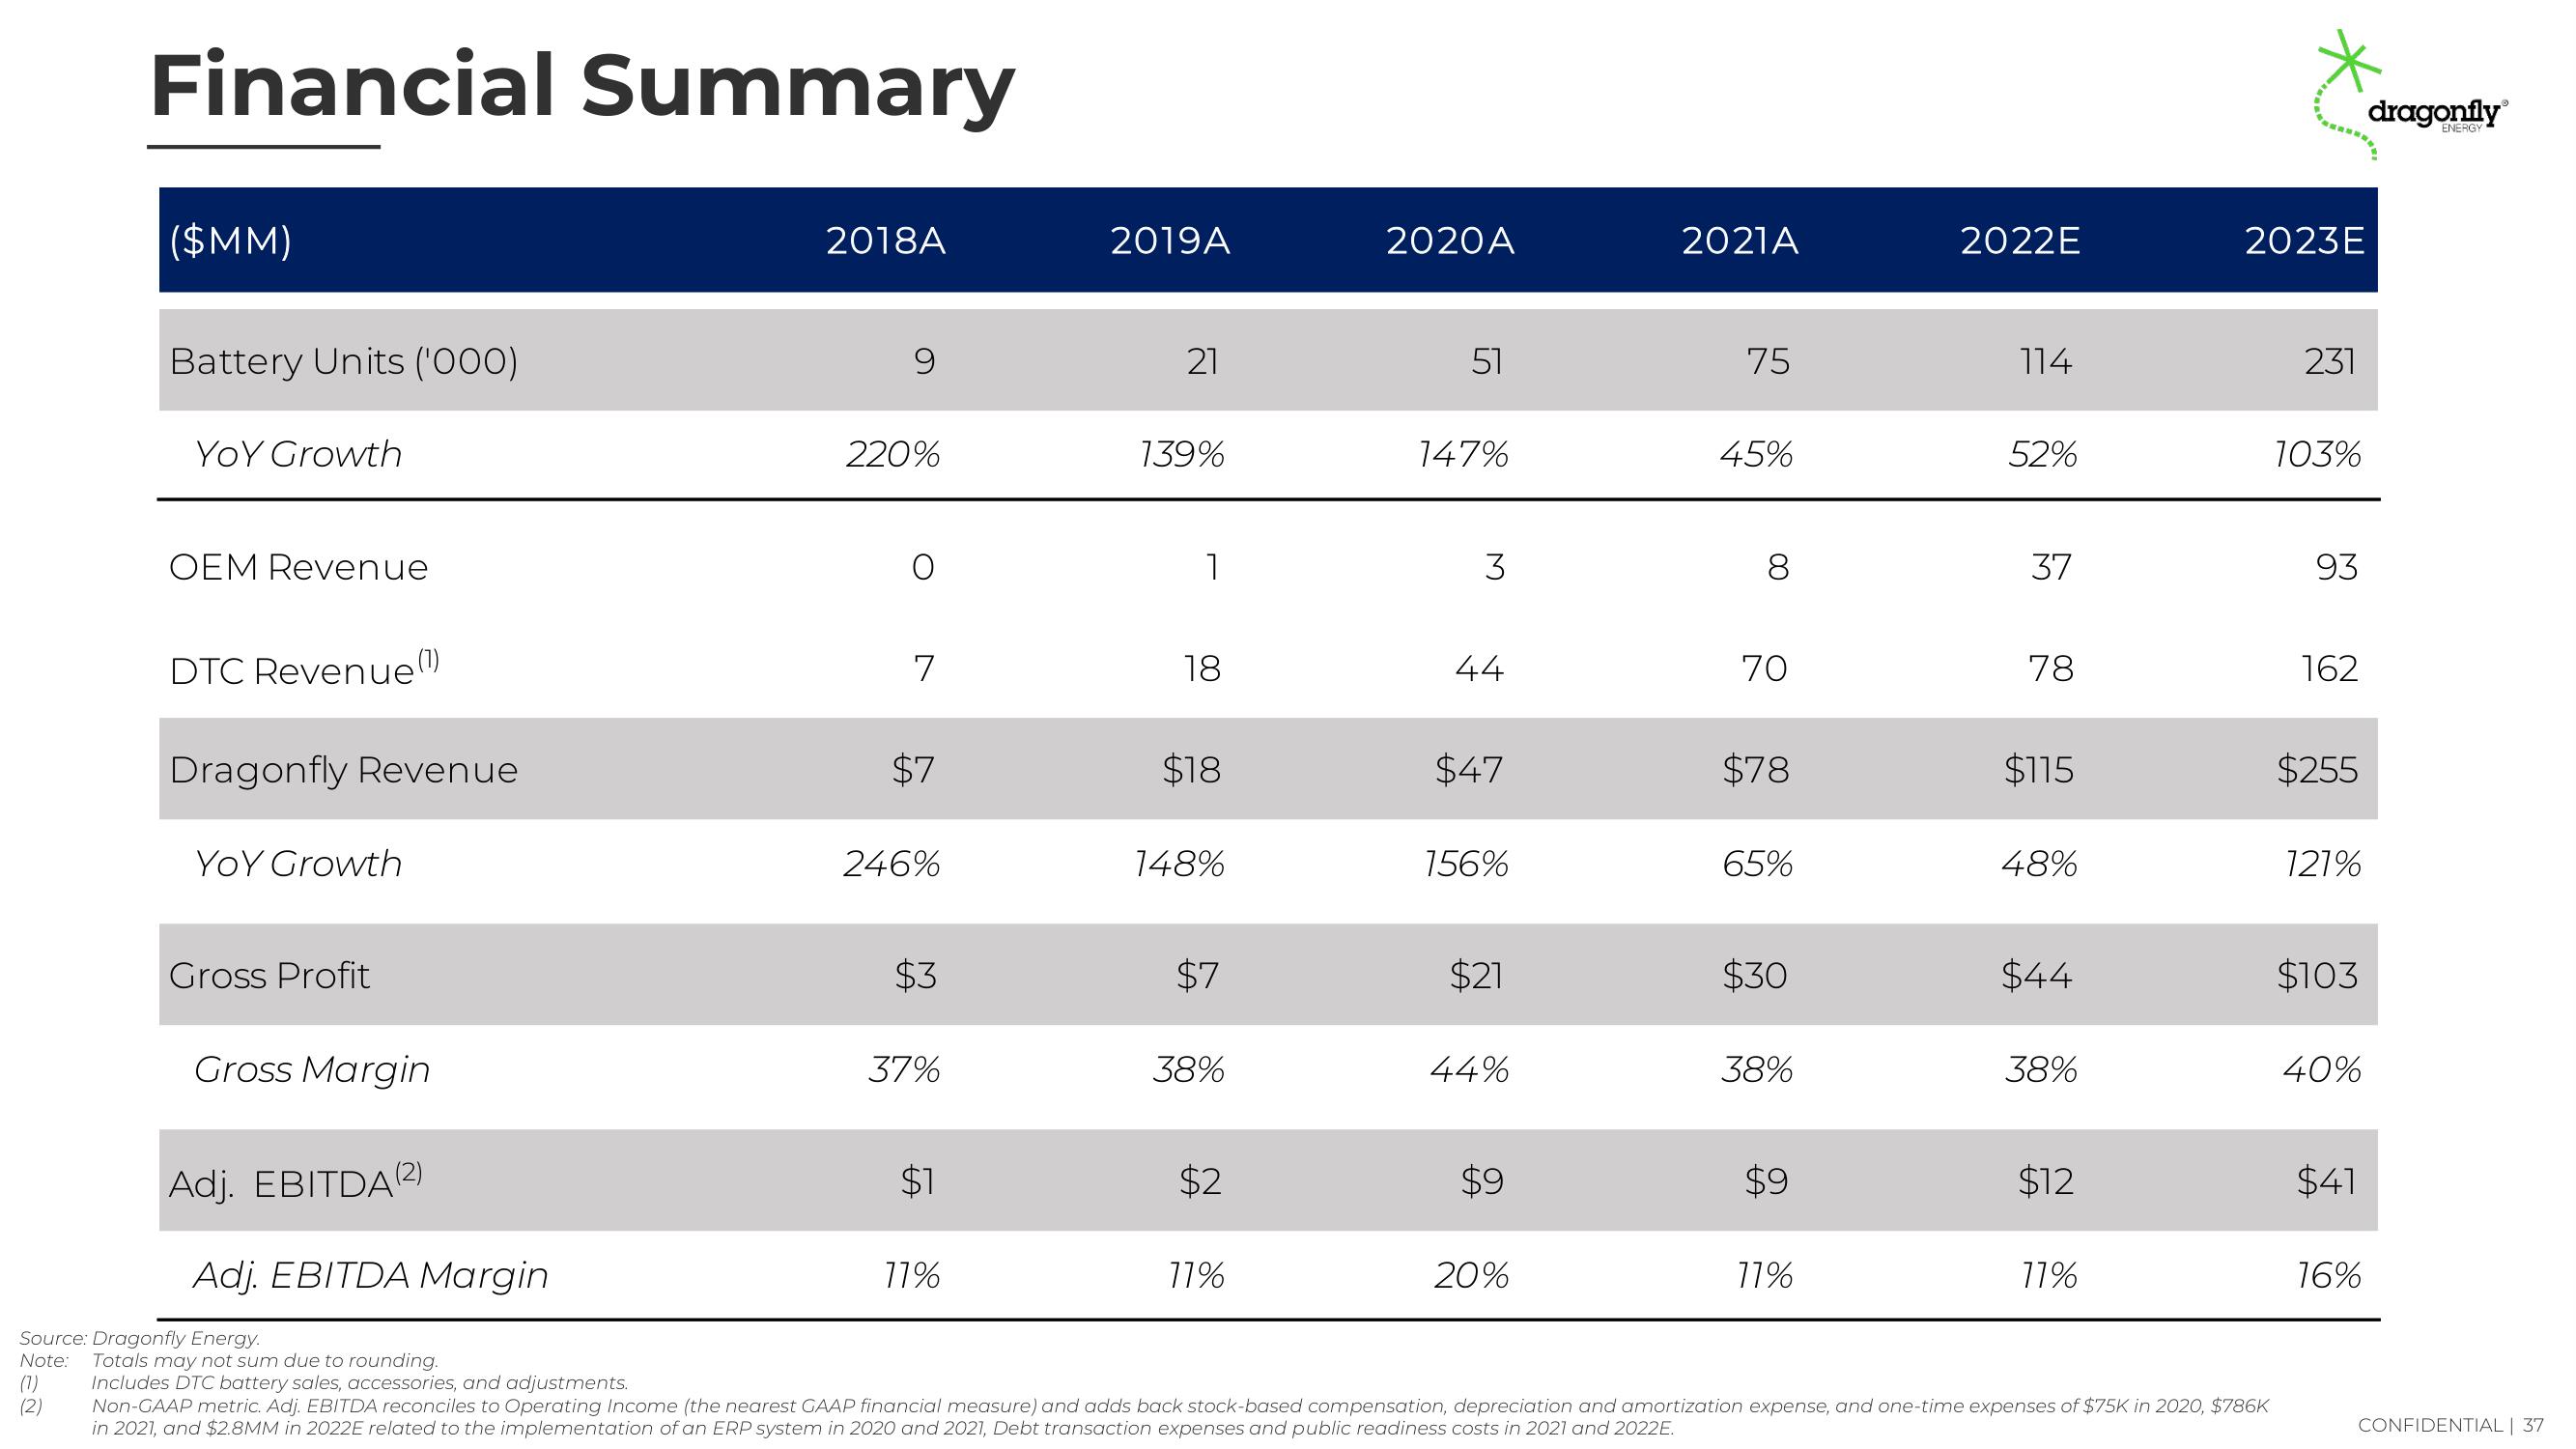
Financial Summary
(7)
(2)
($MM)
Battery Units ('000)
YOY Growth
OEM Revenue
DTC Revenue (¹)
Dragonfly Revenue
YOY Growth
Gross Profit
Gross Margin
Adj. EBITDA (2)
Adj. EBITDA Margin
2018A
9
220%
O
7
$7
246%
$3
37%
$1
77%
2019A
21
139%
1
18
$18
148%
$7
38%
$2
77%
2020A
51
147%
3
44
$47
156%
$21
44%
$9
20%
2021A
75
45%
8
70
$78
65%
$30
38%
$9
17%
2022E
114
52%
37
78
$115
48%
$44
38%
$12
11%
2023E
Source: Dragonfly Energy.
Note: Totals may not sum due to rounding.
Includes DTC battery sales, accessories, and adjustments.
Non-GAAP metric. Adj. EBITDA reconciles to Operating Income (the nearest GAAP financial measure) and adds back stock-based compensation, depreciation and amortization expense, and one-time expenses of $75K in 2020, $786K
in 2021, and $2.8MM in 2022E related to the implementation of an ERP system in 2020 and 2021, Debt transaction expenses and public readiness costs in 2021 and 2022E.
231
103%
93
162
$255
121%
$103
40%
$41
16%
dragonfly
CONFIDENTIAL | 37View entire presentation