Embracer Group Results Presentation Deck
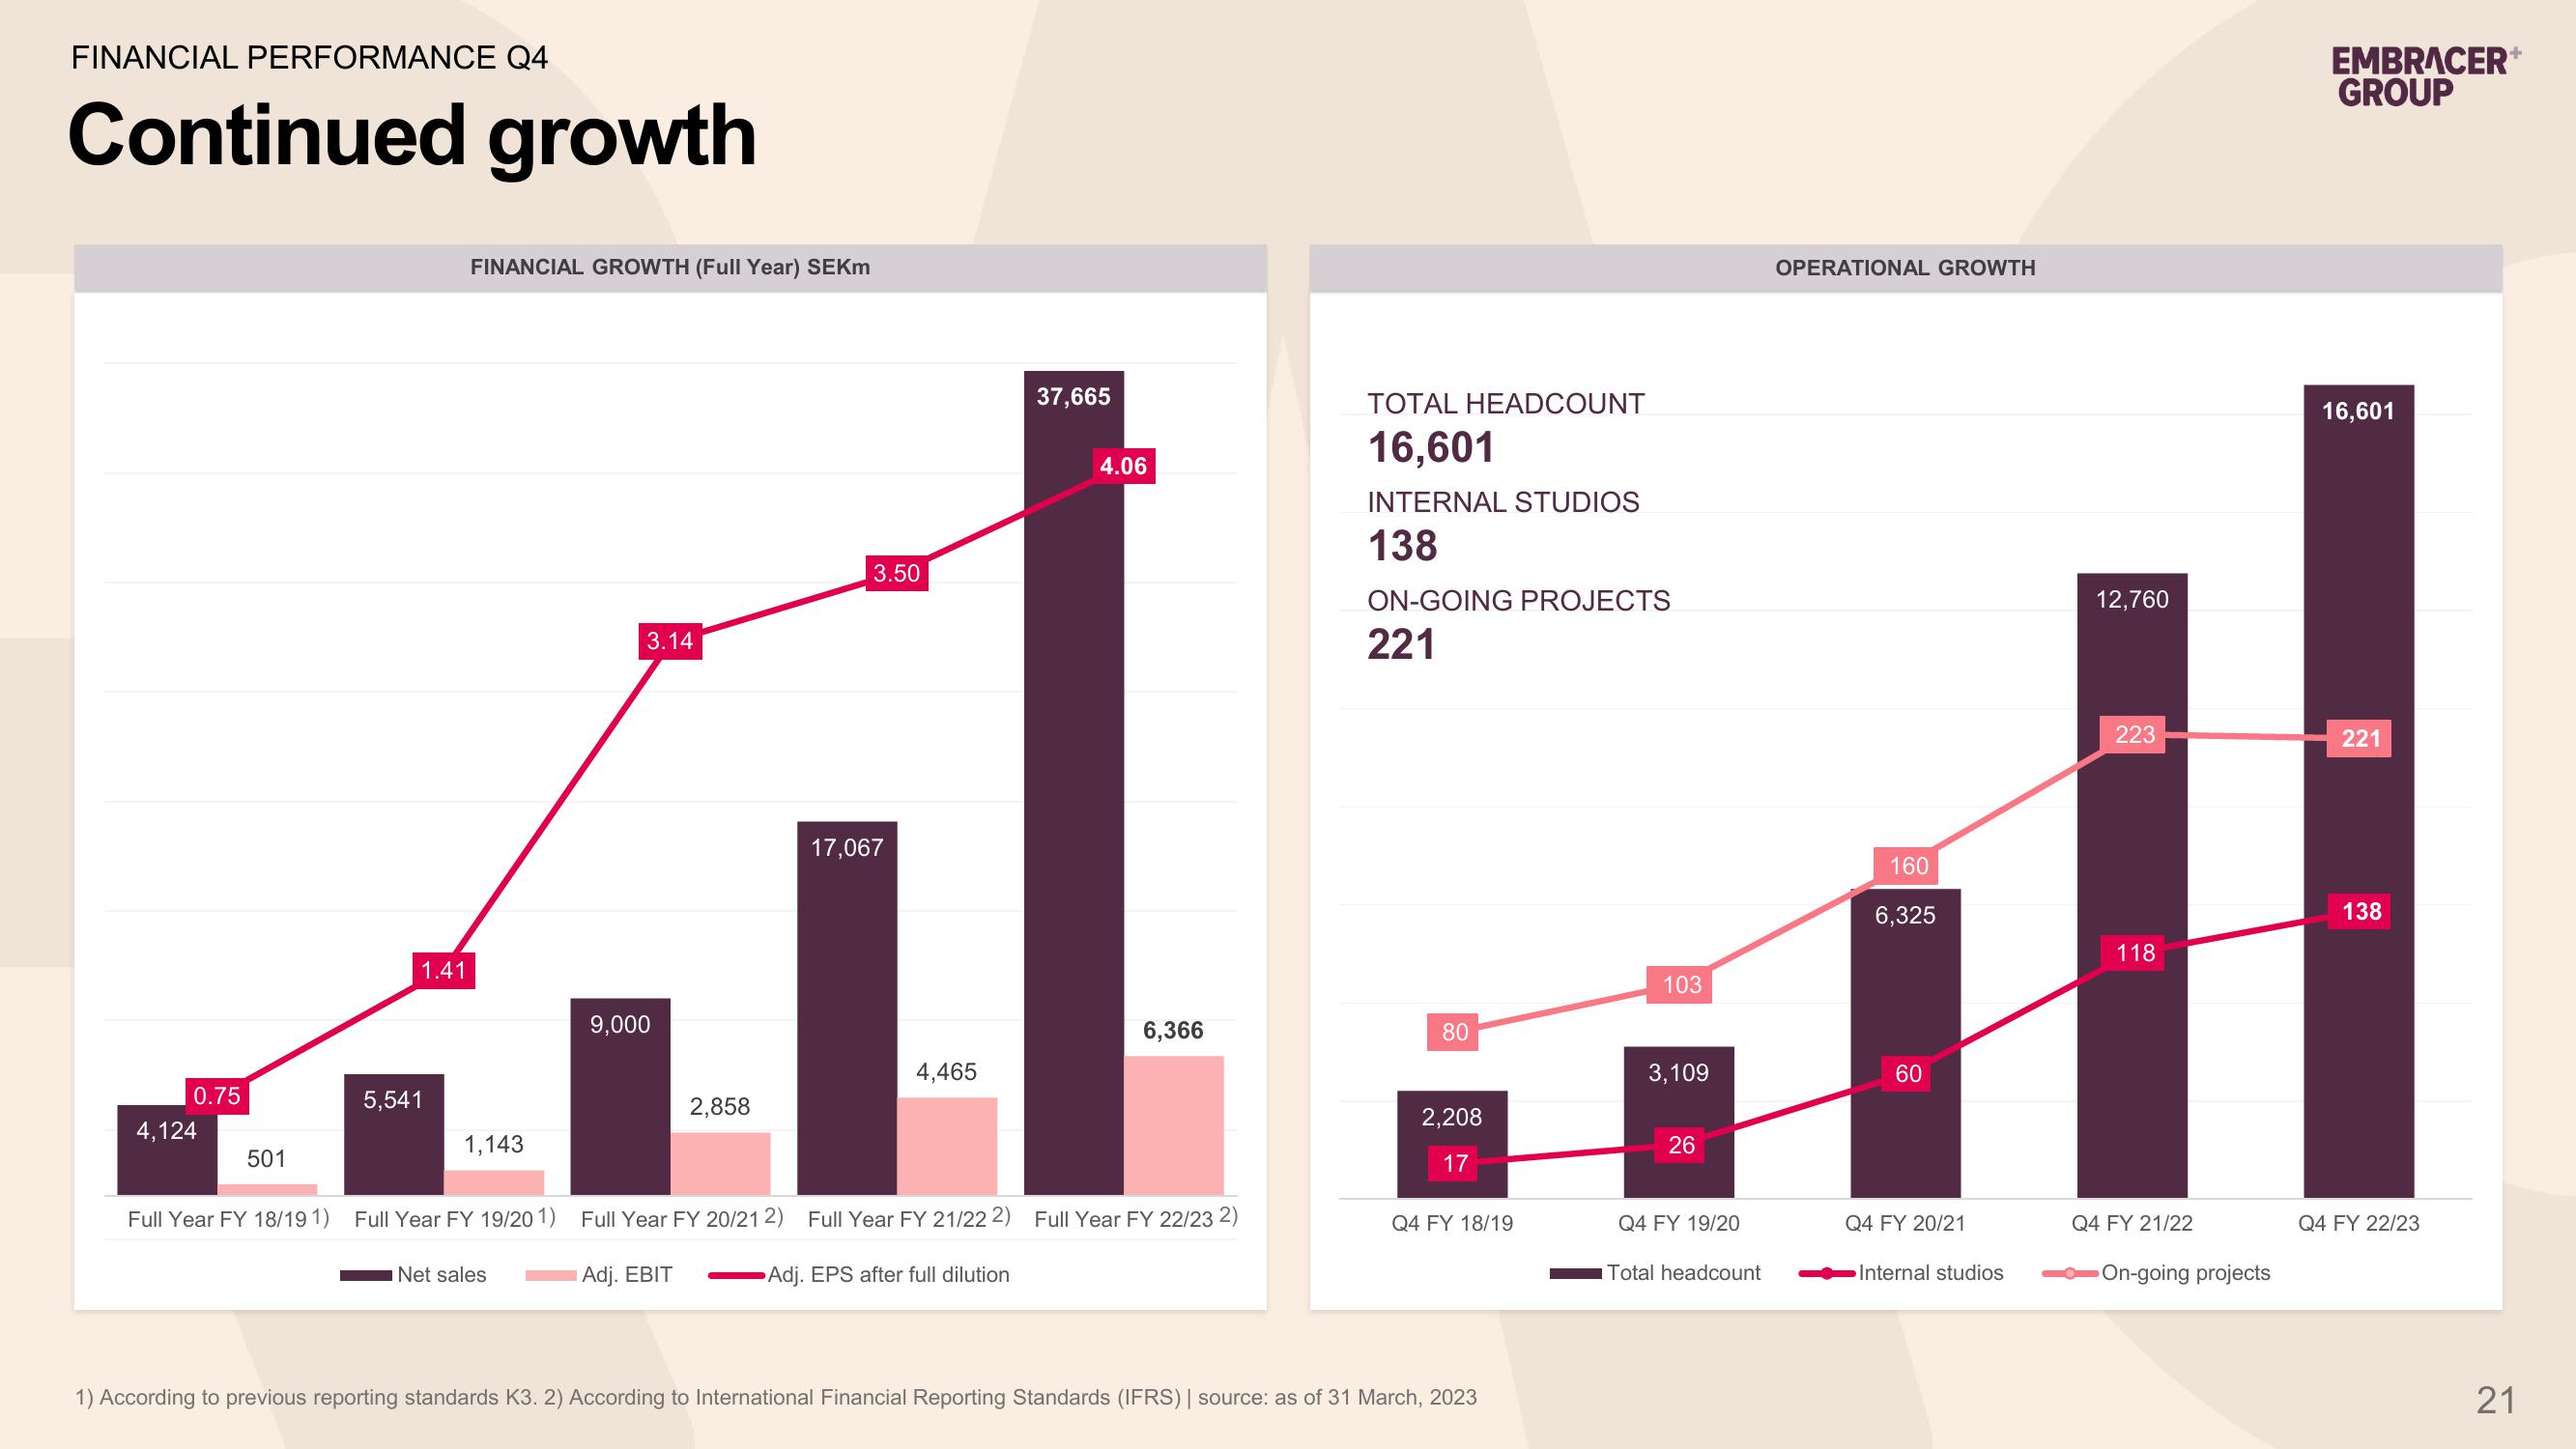
FINANCIAL PERFORMANCE Q4
Continued growth
0.75
4,124
501
1.41
5,541
FINANCIAL GROWTH (Full Year) SEKM
1,143
Full Year FY 18/191) Full Year FY 19/201)
Net sales
3.14
9,000
2,858
3.50
17,067
4,465
37,665
4.06
6,366
Full Year FY 20/21 2) Full Year FY 21/22 2) Full Year FY 22/232)
Adj. EBIT
Adj. EPS after full dilution
TOTAL HEADCOUNT
16,601
INTERNAL STUDIOS
138
ON-GOING PROJECTS
221
80
2,208
17
Q4 FY 18/19
1) According to previous reporting standards K3. 2) According to International Financial Reporting Standards (IFRS) | source: as of 31 March, 2023
103
3,109
26
Q4 FY 19/20
Total headcount
OPERATIONAL GROWTH
160
6,325
60
Q4 FY 20/21
Internal studios
12,760
223
118
Q4 FY 21/22
On-going projects
EMBRACER+
GROUP
16,601
221
138
Q4 FY 22/23
21View entire presentation