ironSource Results Presentation Deck
Q2 22 INVESTOR PRESENTATION
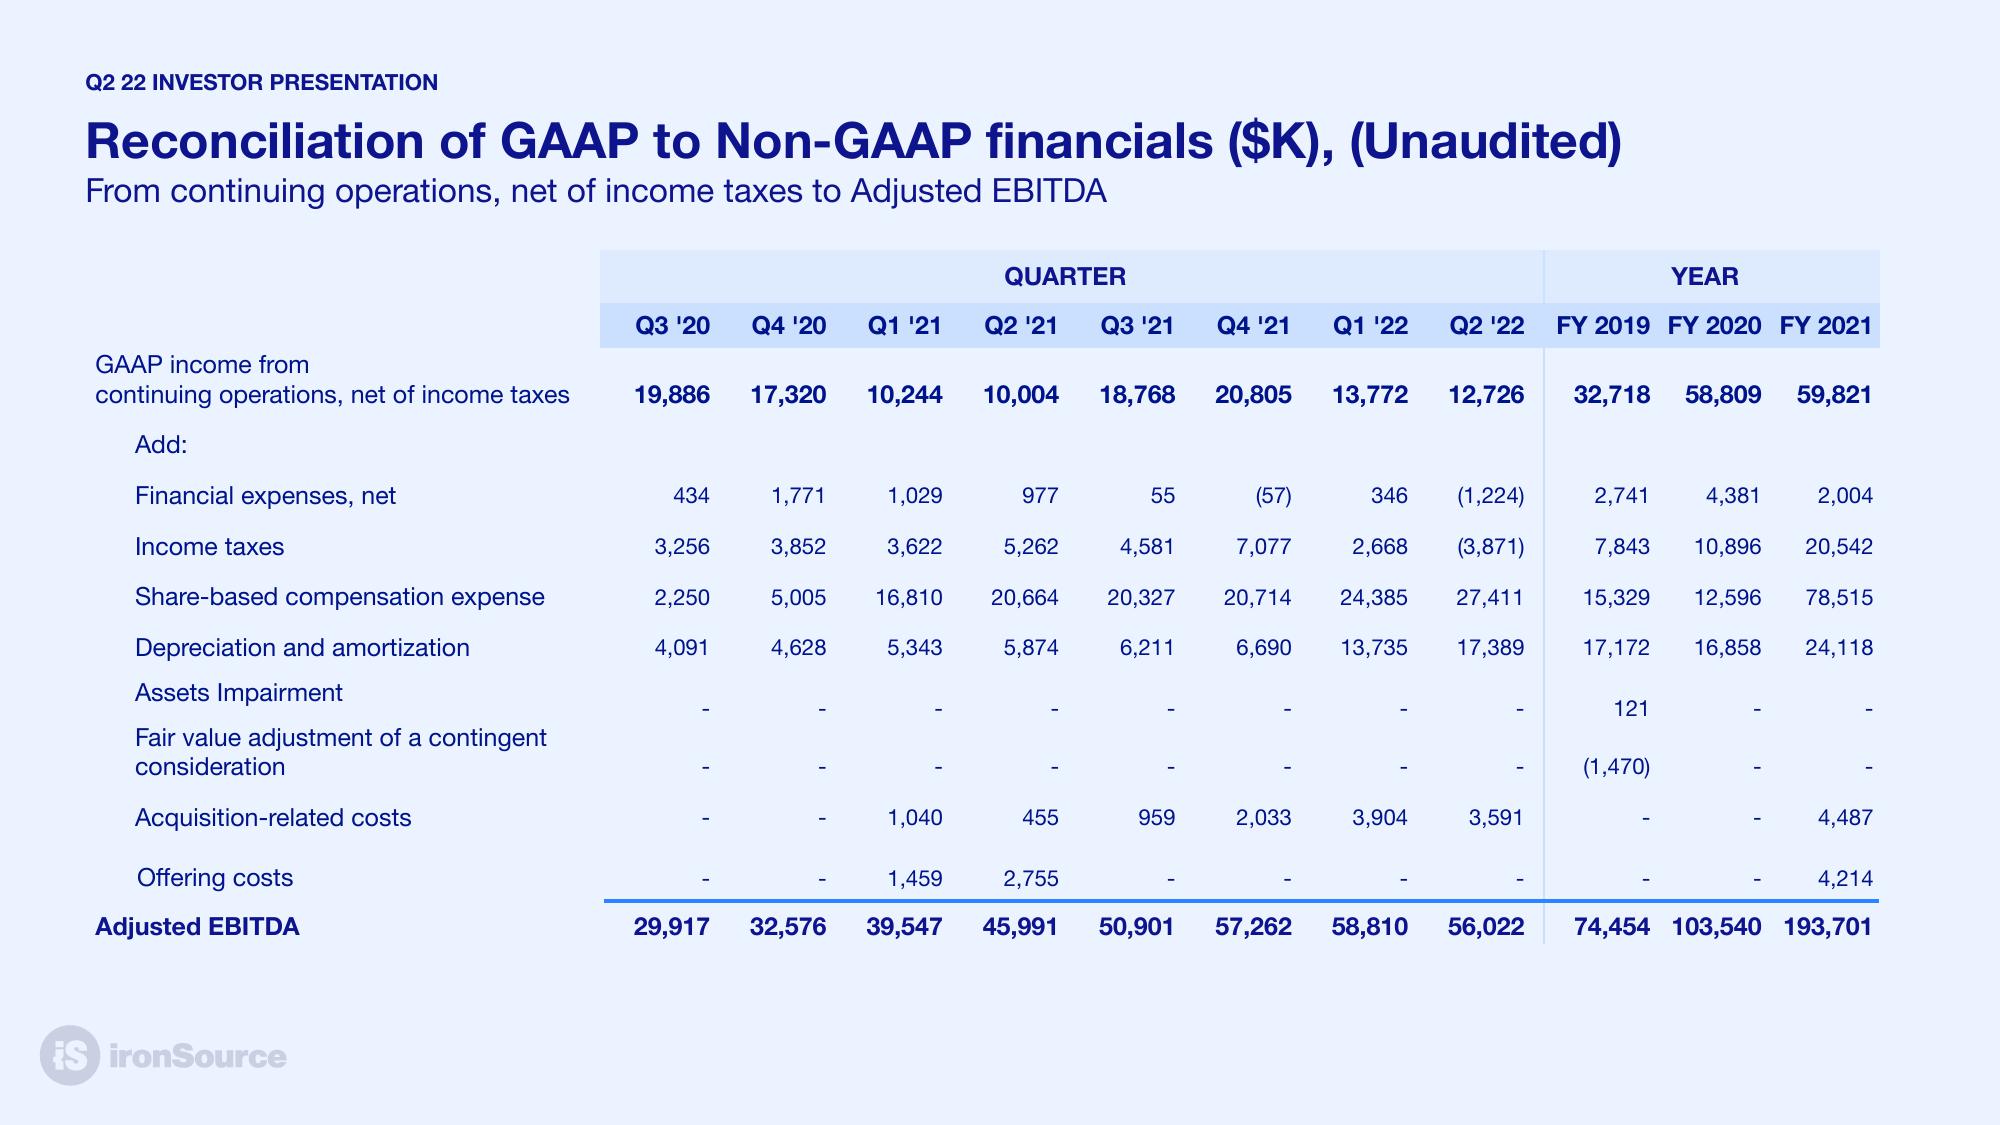
Reconciliation of GAAP to Non-GAAP financials ($K), (Unaudited)
From continuing operations, net of income taxes to Adjusted EBITDA
GAAP income from
continuing operations, net of income taxes
Add:
Financial expenses, net
Income taxes
Share-based compensation expense
Depreciation and amortization
Assets Impairment
Fair value adjustment of a contingent
consideration
Acquisition-related costs
Offering costs
Adjusted EBITDA
ES ironSource
Q3 '20 Q4 '20 Q1 '21
19,886
434
3,256
2,250
4,091
17,320 10,244
1,771
3,852
5,005
4,628
1,029
3,622
16,810
5,343
1,040
QUARTER
Q2 '21
10,004 18,768
977
Q3 '21 Q4 '21 Q1 ¹22
5,262
455
55
(57)
4,581
7,077
20,664 20,327 20,714 24,385
5,874
6,211
6,690 13,735
959
1,459
2,755
29,917 32,576 39,547 45,991 50,901
20,805 13,772 12,726
2,033
346
57,262
2,668
Q2 ¹22
3,904
(1,224)
(3,871)
27,411
17,389
3,591
YEAR
FY 2019 FY 2020 FY 2021
32,718 58,809
2,741
121
4,381
(1,470)
59,821
7,843 10,896 20,542
15,329 12,596 78,515
17,172 16,858 24,118
2,004
4,487
4,214
58,810 56,022 74,454 103,540 193,701View entire presentation