Repay SPAC
H1 2019 Financial Update
($ in mm)
Card Payment Volume
Processing and Service Fees
Interchange and Network Fees
Total Revenue
Interchange and Network Fees
Other Cost of Services
Gross Profit (¹)
SG&A
EBITDA
Depreciation and Amortization
Interest Expense
Net Income
Adjusted EBITDA(²)
Adjusted Net Income
REPAY
Realtime Electronic Payments
(3)
Six Months Ended June 30,
2019
$4,656.0
47.0
28.5
$75.5
28.5
12.0
$35.0
17.1
$17.8
5.9
2.9
$9.0
$21.8
$16.7
2018
$3,589.4
40.5
23.4
$63.9
23.4
14.0
$26.5
13.9
$12.6
4.9
3.0
$4.7
$17.9
$13.7
Amount
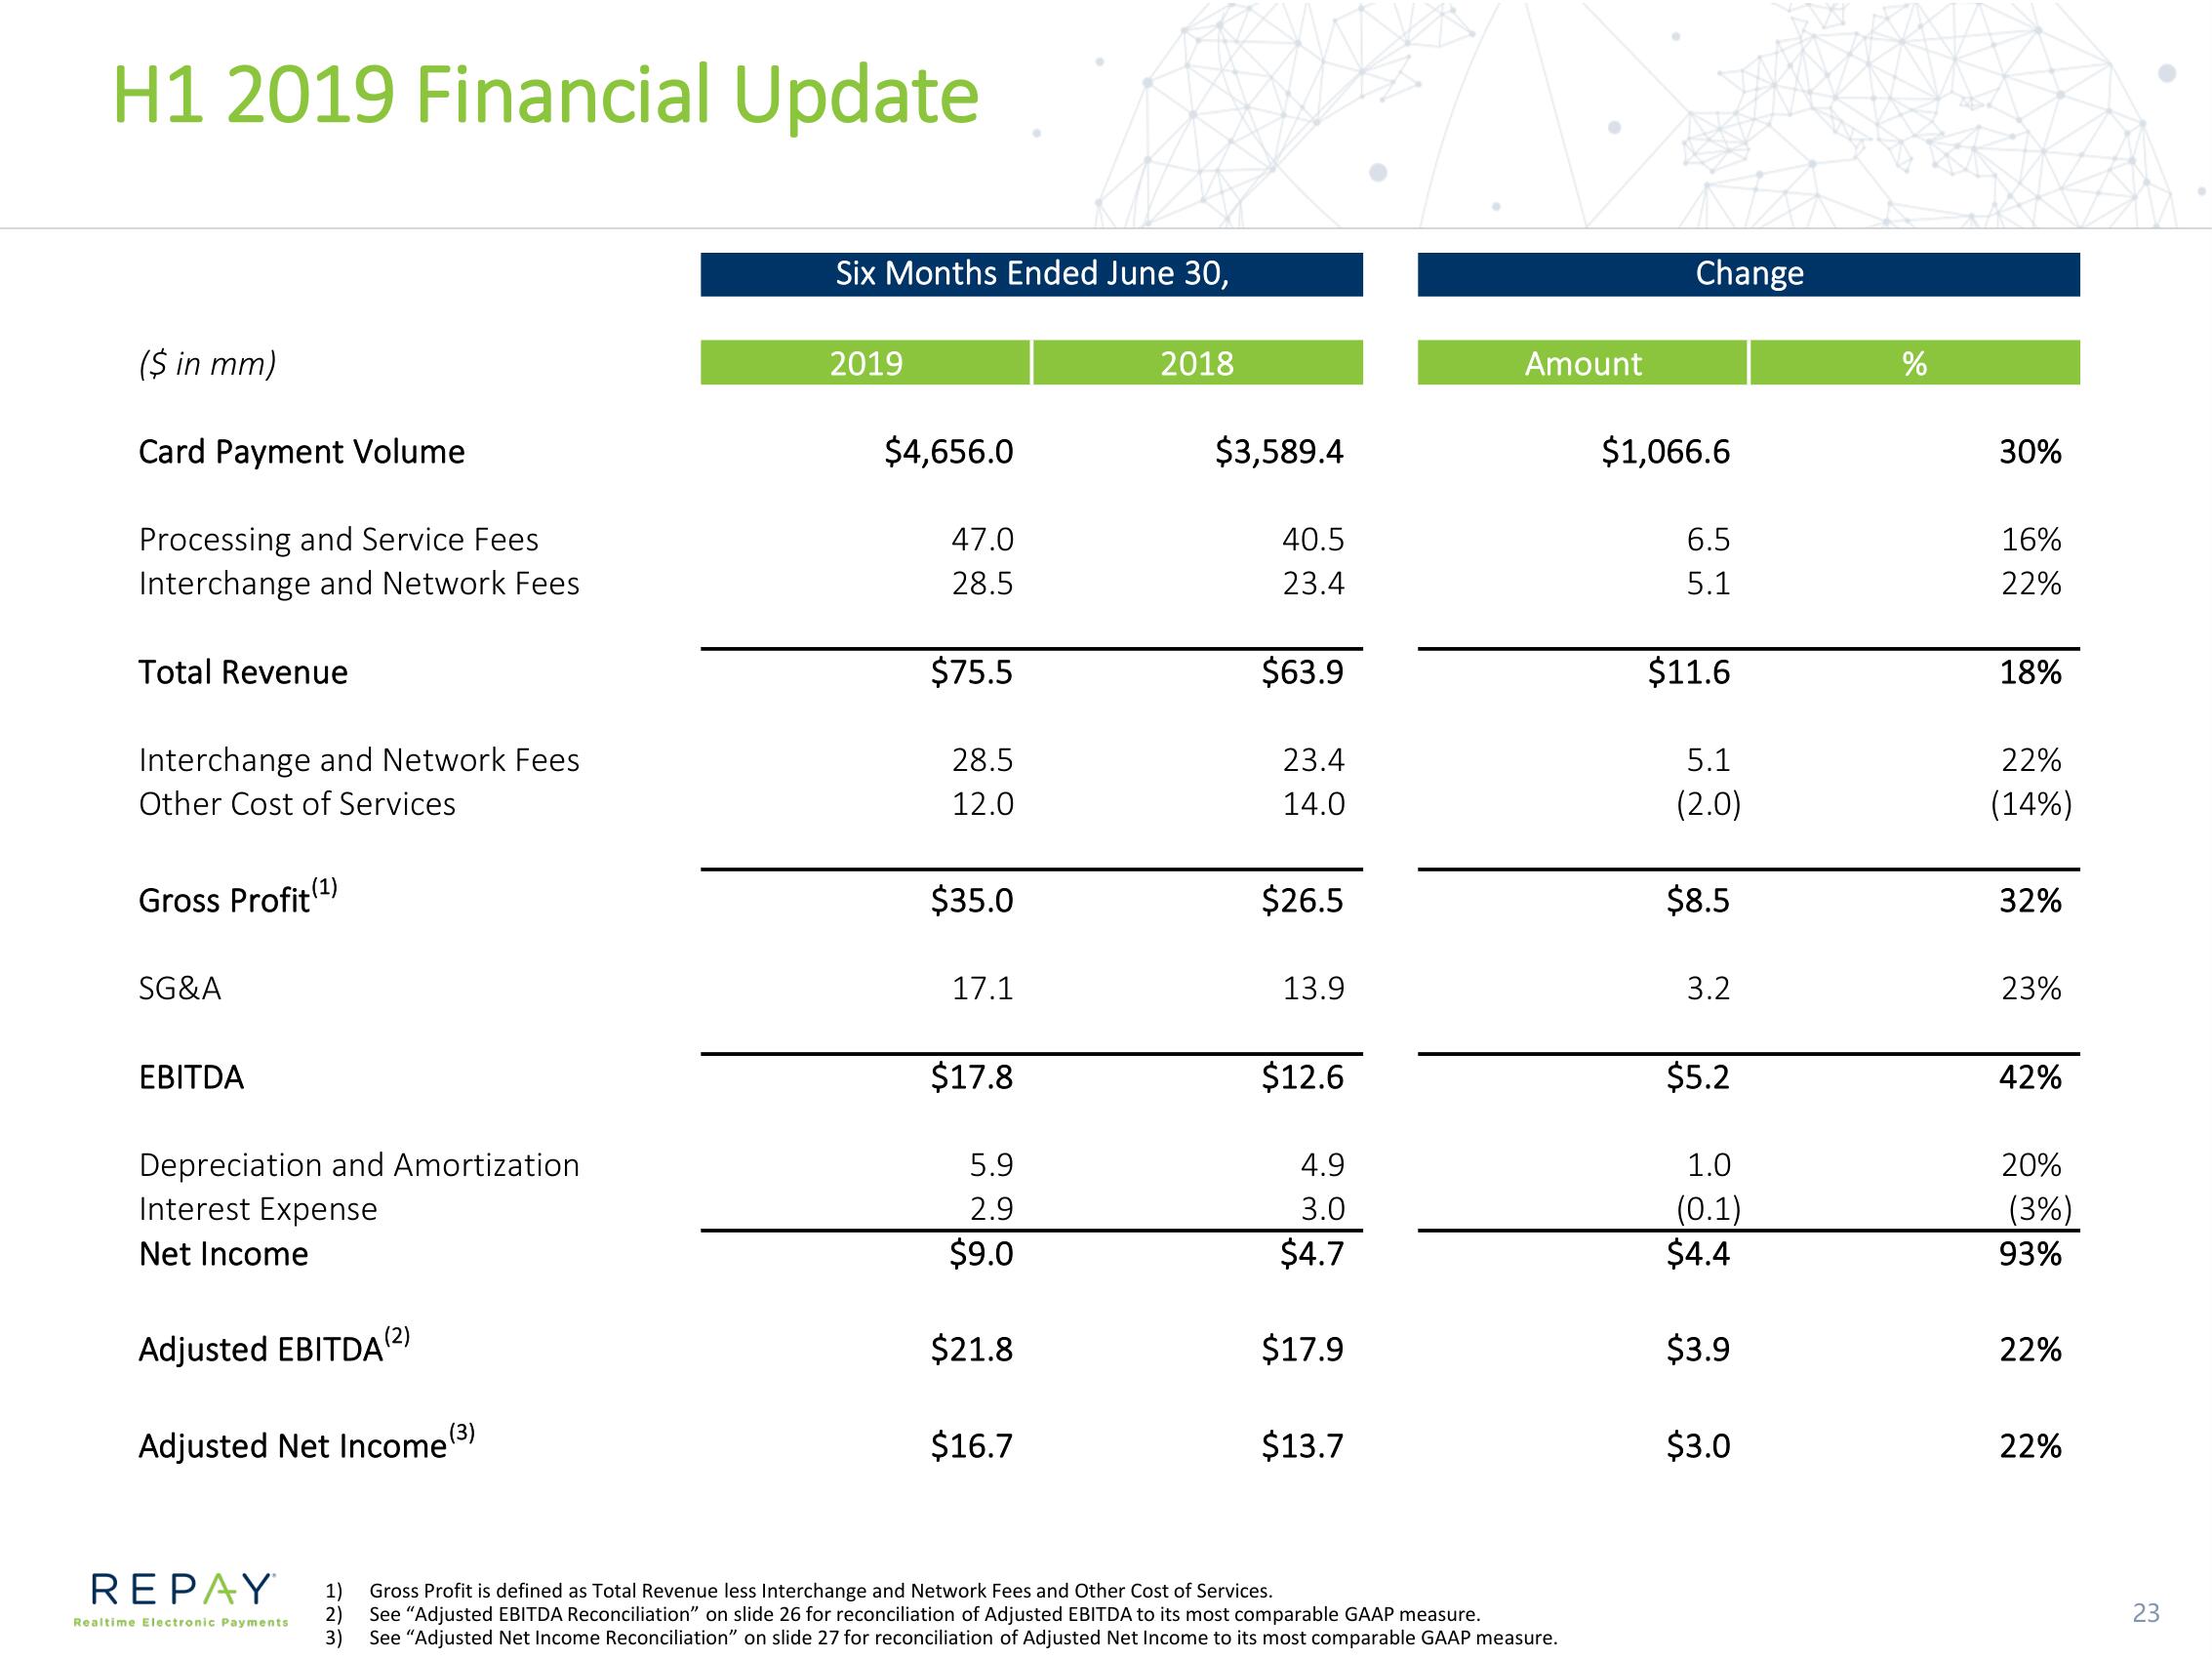
1) Gross Profit is defined as Total Revenue less Interchange and Network Fees and Other Cost of Services.
2) See "Adjusted EBITDA Reconciliation" on slide 26 for reconciliation of Adjusted EBITDA to its most comparable GAAP measure.
3) See "Adjusted Net Income Reconciliation" on slide 27 for reconciliation of Adjusted Net Income to its most comparable GAAP measure.
Change
$1,066.6
6.5
5.1
$11.6
5.1
(2.0)
$8.5
3.2
$5.2
1.0
(0.1)
$4.4
$3.9
$3.0
%
30%
16%
22%
18%
22%
(14%)
32%
23%
42%
20%
(3%)
93%
22%
22%
23View entire presentation