Spotify Results Presentation Deck
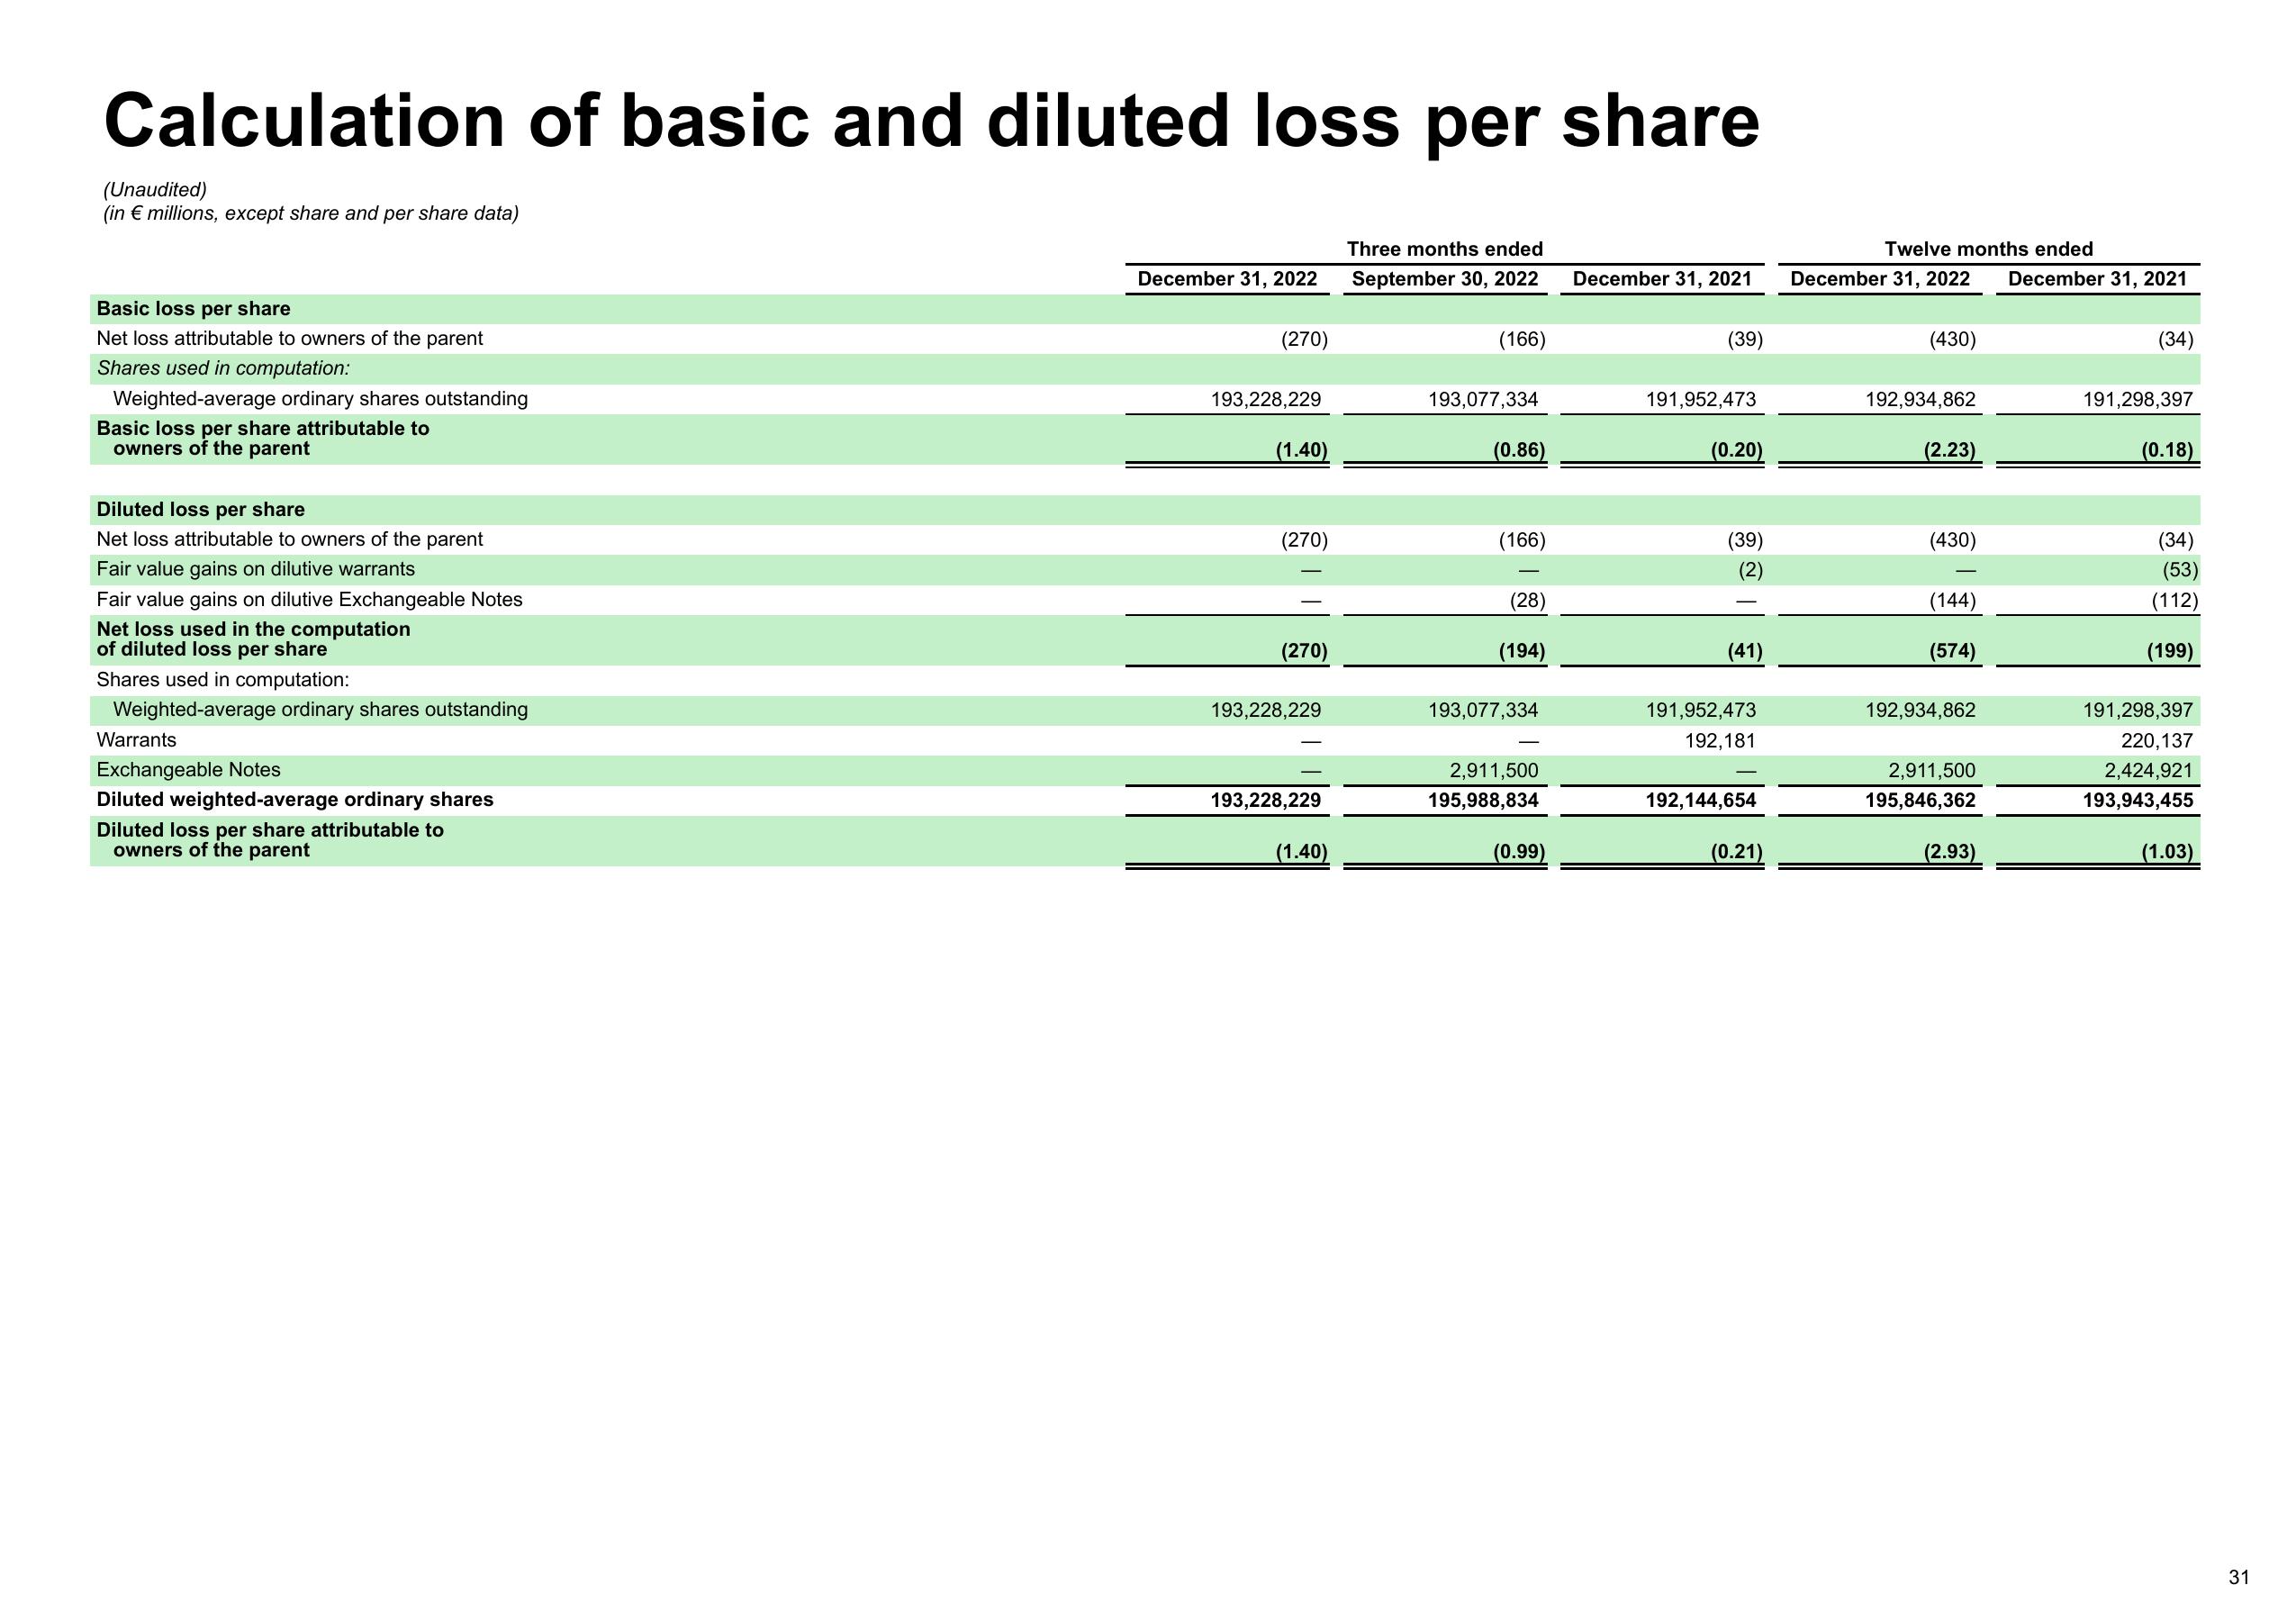
Calculation of basic and diluted loss per share
(Unaudited)
(in € millions, except share and per share data)
Basic loss per share
Net loss attributable to owners of the parent
Shares used in computation:
Weighted-average ordinary shares outstanding
Basic loss per share attributable to
owners of the parent
Diluted loss per share
Net loss attributable to owners of the parent
Fair value gains on dilutive warrants
Fair value gains on dilutive Exchangeable Notes
Net loss used in the computation
of diluted loss per share
Shares used in computation:
Weighted-average ordinary shares outstanding
Warrants
Exchangeable Notes
Diluted weighted-average ordinary shares
Diluted loss per share attributable to
owners of the parent
December 31, 2022
(270)
193,228,229
(1.40)
(270)
(270)
193,228,229
193,228,229
(1.40)
Three months ended
September 30, 2022
(166)
193,077,334
(0.86)
(166)
-
(28)
(194)
193,077,334
2,911,500
195,988,834
(0.99)
December 31, 2021
(39)
191,952,473
(0.20)
(39)
(41)
191,952,473
192,181
192,144,654
(0.21)
Twelve months ended
December 31, 2022 December 31, 2021
(430)
192,934,862
(2.23)
(430)
(144)
(574)
192,934,862
2,911,500
195,846,362
(2.93)
(34)
191,298,397
(0.18)
(34)
(53)
(112)
(199)
191,298,397
220,137
2,424,921
193,943,455
(1.03)
31View entire presentation