XP Inc Results Presentation Deck
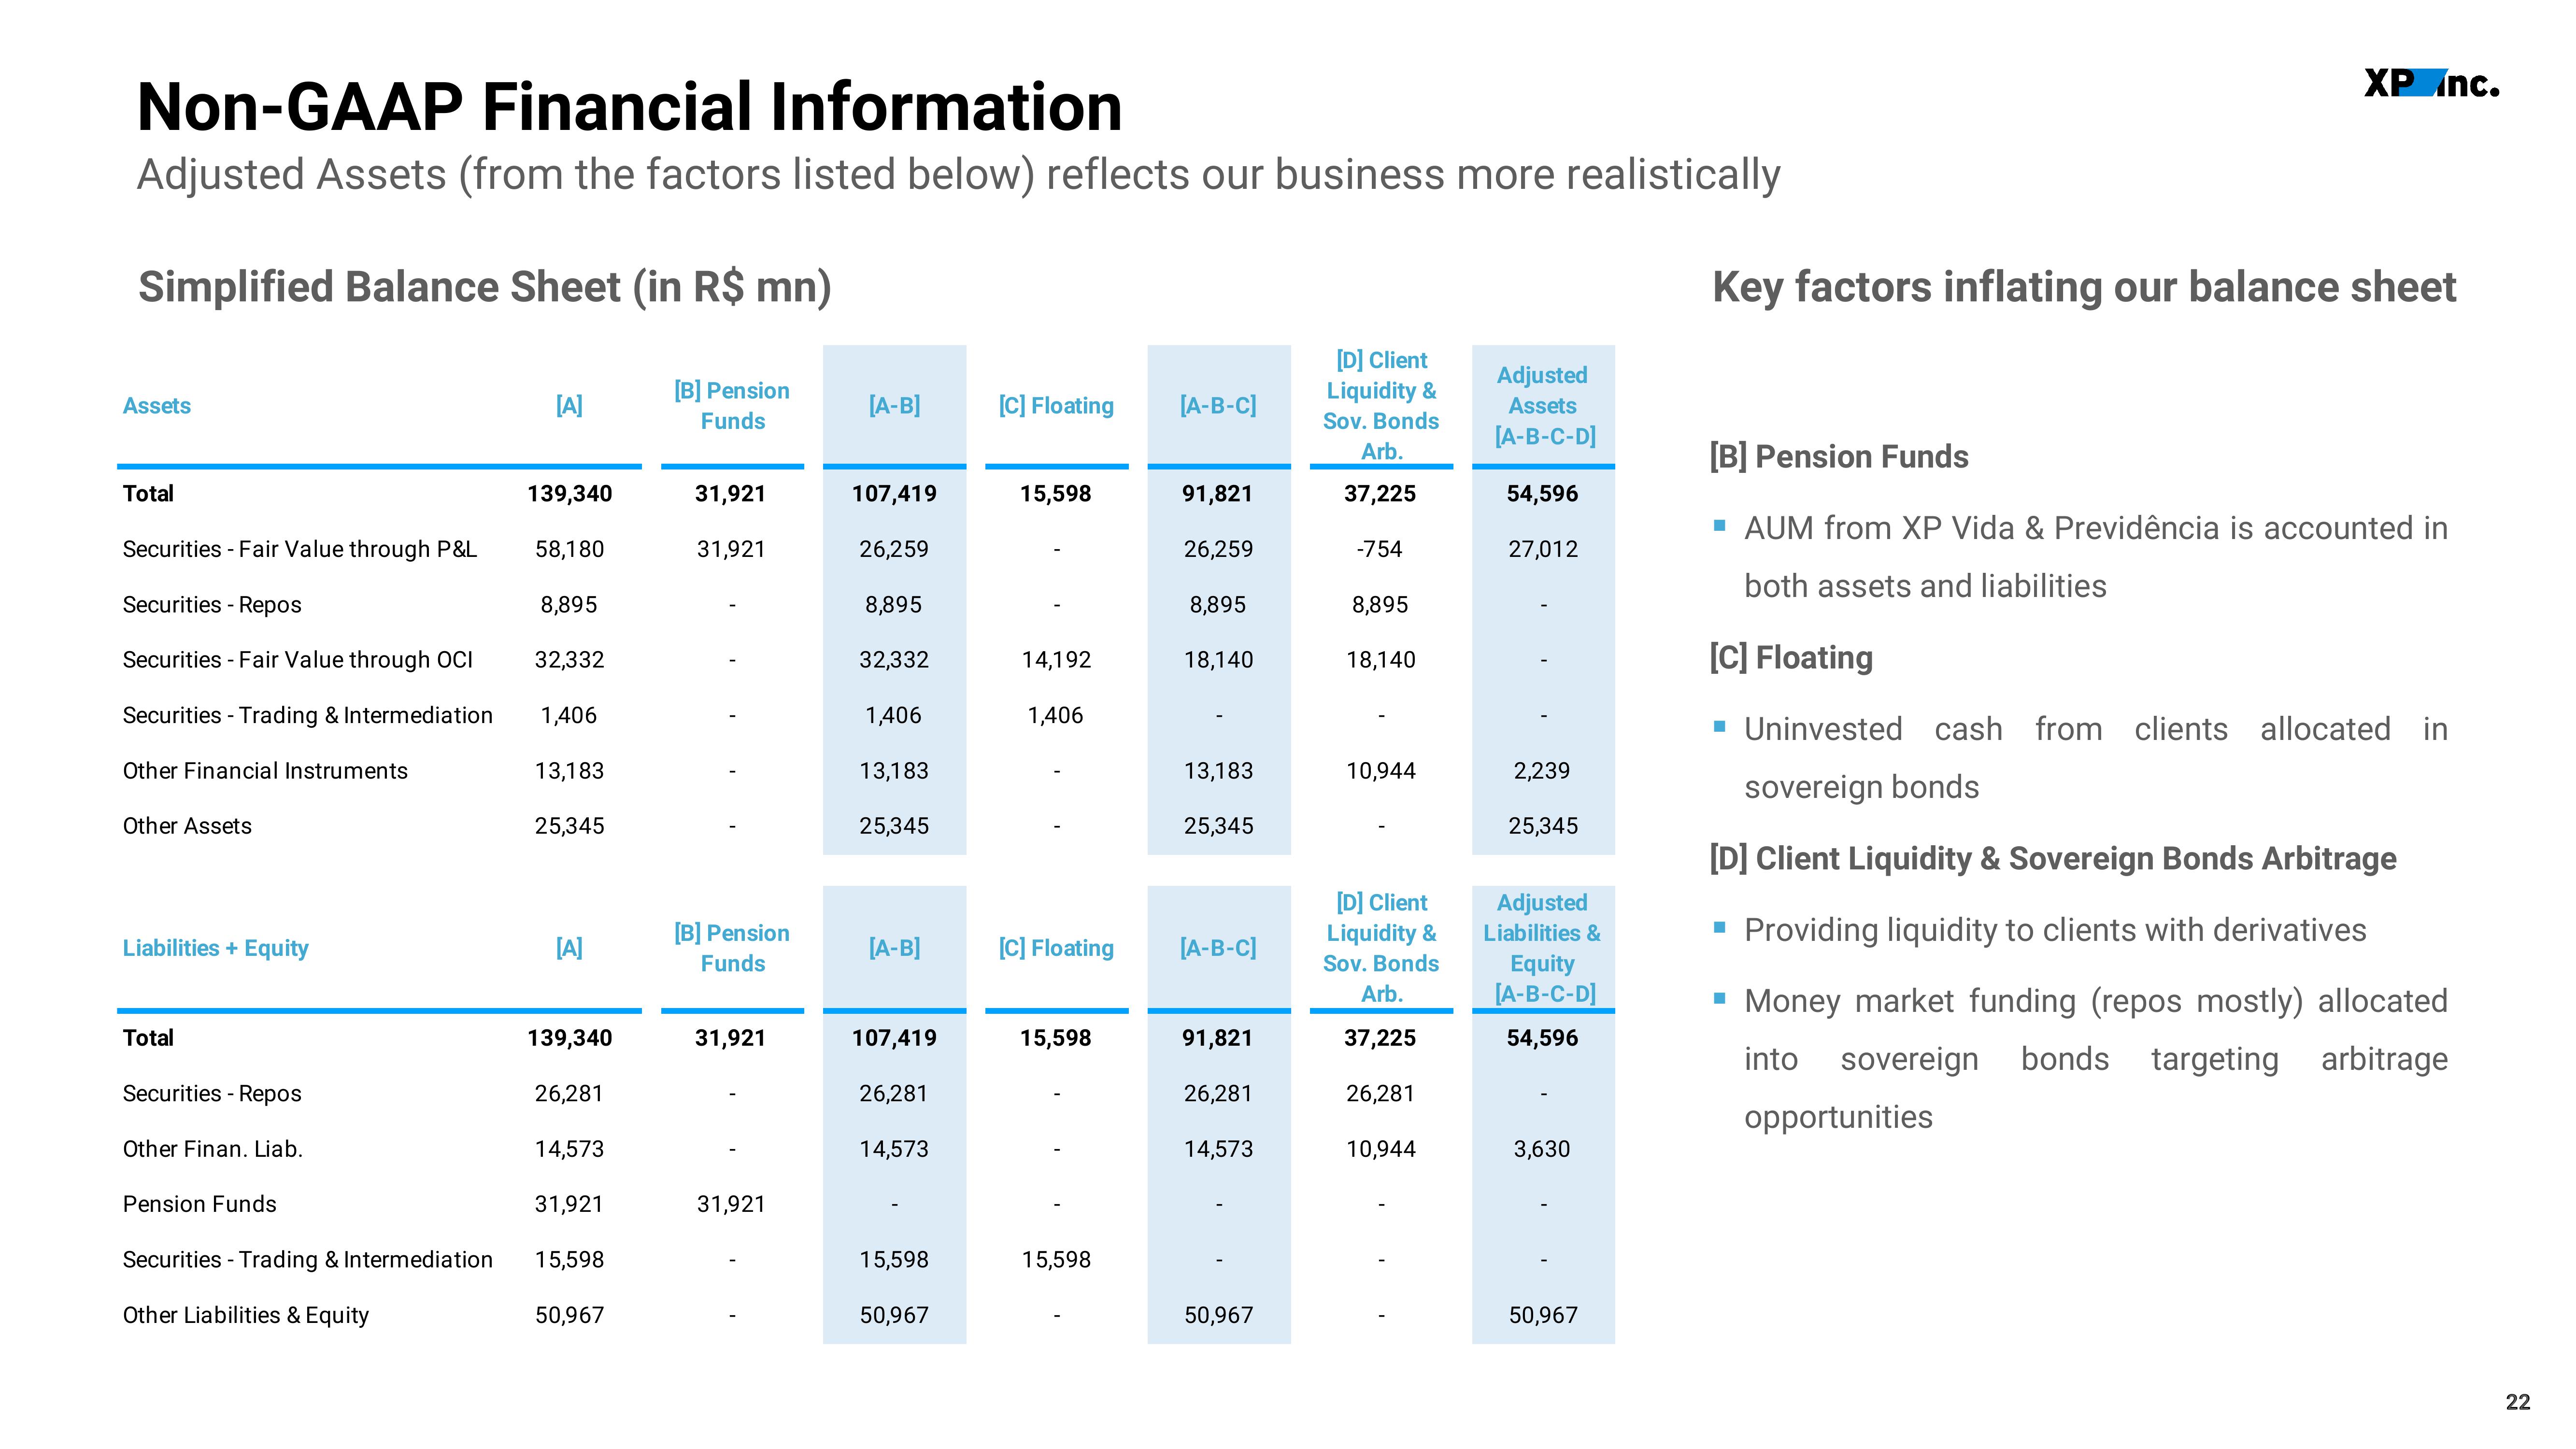
Non-GAAP Financial Information
Adjusted Assets (from the factors listed below) reflects our business more realistically
Simplified Balance Sheet (in R$ mn)
[B] Pension
Funds
Assets
Total
Securities - Fair Value through P&L
Securities - Repos
Securities - Fair Value through OCI
Securities - Trading & Intermediation
Other Financial Instruments
Other Assets
Liabilities + Equity
Total
Securities - Repos
Other Finan. Liab.
Pension Funds
Securities - Trading & Intermediation
Other Liabilities & Equity
[A]
139,340
58,180
8,895
32,332
1,406
13,183
25,345
[A]
139,340
26,281
14,573
31,921
15,598
50,967
31,921
31,921
[B] Pension
Funds
31,921
31,921
[A-B]
107,419
26,259
8,895
32,332
1,406
13,183
25,345
[A-B]
107,419
26,281
14,573
15,598
50,967
[C] Floating
15,598
14,192
1,406
[C] Floating
15,598
15,598
[A-B-C]
91,821
26,259
8,895
18,140
13,183
25,345
[A-B-C]
91,821
26,281
14,573
50,967
[D] Client
Liquidity &
Sov. Bonds
Arb.
37,225
-754
8,895
18,140
10,944
[D] Client
Liquidity &
Sov. Bonds
Arb.
37,225
26,281
10,944
Adjusted
Assets
[A-B-C-D]
54,596
27,012
2,239
25,345
Adjusted
Liabilities &
Equity
[A-B-C-D]
54,596
3,630
50,967
Key factors inflating our balance sheet
XP Inc.
[B] Pension Funds
▪ AUM from XP Vida & Previdência is accounted in
both assets and liabilities
[C] Floating
▪ Uninvested cash from clients allocated in
sovereign bonds
[D] Client Liquidity & Sovereign Bonds Arbitrage
Providing liquidity to clients with derivatives
▪ Money market funding (repos mostly) allocated
into sovereign bonds targeting arbitrage
■
opportunities
22View entire presentation